Exam 3: Functions and Graphs
Exam 1: Algebra and Equations409 Questions
Exam 2: Graphs, Lines, and Inequalities255 Questions
Exam 3: Functions and Graphs323 Questions
Exam 4: Exponential and Logarithmic Functions192 Questions
Exam 5: Mathematics of Finance183 Questions
Exam 6: Systems of Linear Equations and Matrices215 Questions
Exam 7: Linear Programming203 Questions
Exam 8: Sets and Probability240 Questions
Exam 9: Counting, Probability Distributions, and Further Topics in Probability210 Questions
Exam 10: Introduction to Statistics169 Questions
Exam 11: Differential Calculus342 Questions
Exam 12: Applications of the Derivative220 Questions
Exam 13: Integral Calculus227 Questions
Exam 14: Multivariate Calculus152 Questions
Select questions type
Solve the problem.
-A ball is thrown vertically upward at an initial speed of . Its height (in feet) after seconds is given by
What is the height of the ball after 2.7 seconds?
(Multiple Choice)
4.7/5  (35)
(35)
Solve the problem.
-Suppose that the change in pressure of the oil in a reservoir can be approximated by:
Where is time in years from the date of the first reading. This function is valid for . By sketching a graph of , estimate during what time period the change in pressure is decreasing.
(Multiple Choice)
4.8/5 (35)
Use the vertical line test to determine if the graph is a graph of a function.
-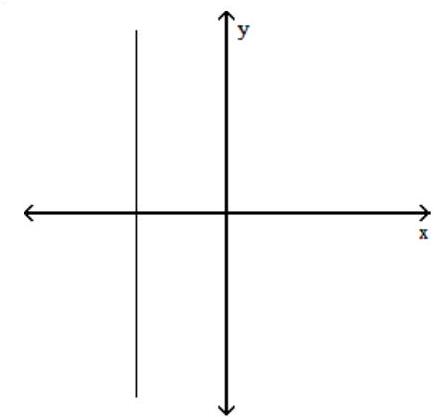
(True/False)
4.8/5 (42)
Find the and intercepts. If no intercepts exist, state so.
-
(Multiple Choice)
4.8/5 (29)
Solve the problem.
-Suppose that the change in pressure of the oil in a reservoir can be approximated by:
Where is time in years from the date of the first reading. This function is valid for . By sketching a graph of , estimate when the change in pressure is maximum.
(Multiple Choice)
4.8/5 (45)
Solve the problem.
-The graph of a function is given below. Tell whether the graph could possibly be the graph of a polynomial function. If it could be the graph of a polynomial function, tell which of the following are possible degrees for the polynomial function: 3, 4, 5, 6 .
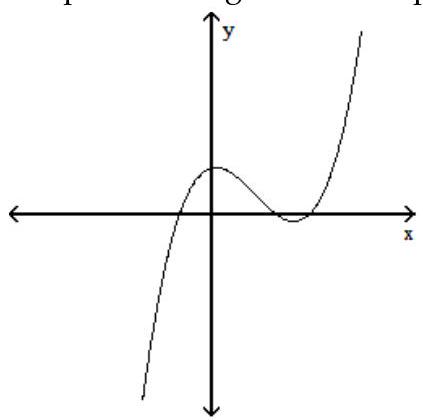
(Multiple Choice)
4.8/5 (38)
Use the graph to solve the problem.
-In one city, the temperature in Fahrenheit on a typical summer day can be approximated by the following function:
Here, represents the number of hours since 6 a.m. The graph of this function is shown below. At what time is the temperature the highest?
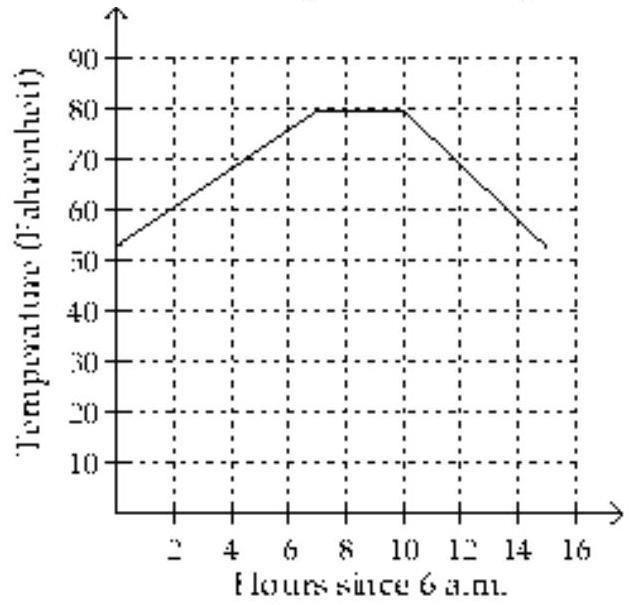
(Multiple Choice)
4.8/5 (37)
Solve the problem.
-Assume that the sales of a computer retail store are approximated by a linear function. Sales were in 1982 and in 1987 . Let represent 1982 . Find the equation giving yearly sales. Estimate sales in 1990.
(Multiple Choice)
4.8/5 (28)
Use the graph to solve the problem.
-In one city, the temperature in Fahrenheit on a typical summer day can be approximated by the following function:
Here, represents the number of hours since 6 a.m. The graph of this function is shown below. Use the graph to estimate the temperature at 7 a.m.
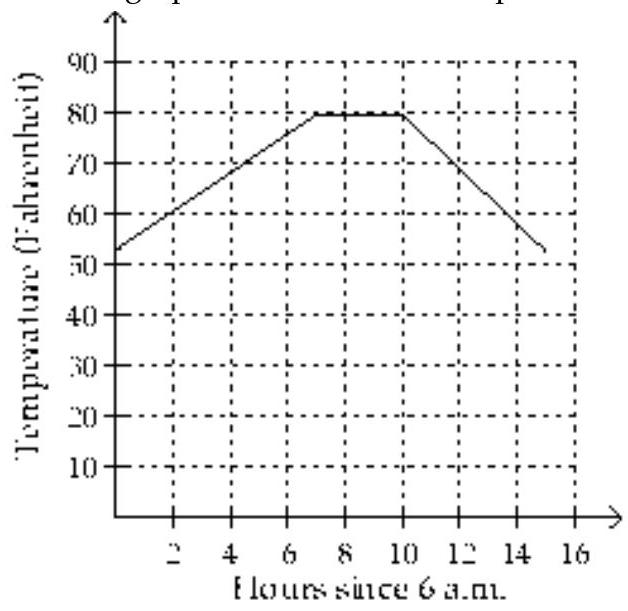
(Multiple Choice)
4.8/5 (25)
Find the appropriate linear cost or revenue function.
-A cable TV company charges for the basic service plus for each movie channel. Let be the total cost in dollars of subscribing to cable TV, using movie channels. Find the linear cost function.
(Multiple Choice)
4.7/5 (21)
Find a quadratic function that models the data.
-The table lists the total precipitation in six consecutive months in one U.S. city.
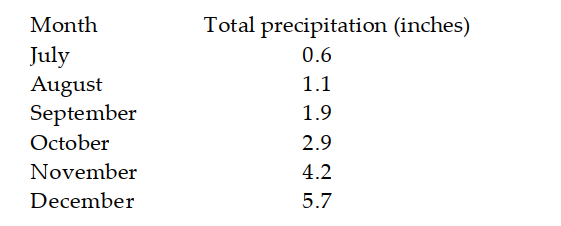 Let correspond to July and let be the total precipitation in month . Using as the vertex and as the other point, determine a quadratic function that models the data.
(Multiple Choice)
4.8/5 (35)
Write a cost function for the problem. Assume that the relationship is linear.
-A moving firm charges a flat fee of plus per hour. Let be the cost in dollars of using the moving firm for hours.
(Multiple Choice)
4.8/5 (30)
Filters
- Essay(0)
- Multiple Choice(0)
- Short Answer(0)
- True False(0)
- Matching(0)