Exam 3: Graphical Descriptive Techniques 2
Exam 1: What Is Statistics46 Questions
Exam 2: Graphical Descriptive Techniques 194 Questions
Exam 3: Graphical Descriptive Techniques 2156 Questions
Exam 4: Numerical Descriptive Techniques275 Questions
Exam 5: Data Collection and Sampling84 Questions
Exam 6: Probability240 Questions
Exam 7: Random Variables and Discrete Probability Distributions283 Questions
Exam 8: Continuous Probability Distributions224 Questions
Exam 9: Sampling Distributions156 Questions
Exam 10: Introduction to Estimation154 Questions
Exam 11: Introduction to Hypothesis Testing189 Questions
Exam 12: Inference About a Population153 Questions
Exam 13: Inference About Comparing Two Populations170 Questions
Exam 14: Analysis of Variance157 Questions
Exam 15: Chi-Squared Tests179 Questions
Exam 16: Simple Linear Regression and Correlation304 Questions
Exam 17: Multiple Regression160 Questions
Exam 18: Model Building148 Questions
Exam 19: Nonparametric Statistics175 Questions
Exam 20: Time-Series Analytics and Forecasting225 Questions
Exam 21: Statistical Process Control140 Questions
Exam 22: Decision Analysis123 Questions
Exam 23: Conclusion47 Questions
Select questions type
The number of crimes per capita is known as the crime ____________________.It is a fairer way to represent and compare crimes from year to year or place to place.
(Short Answer)
4.9/5  (36)
(36)
If the data in a scatter diagram is scattered completely at random,what do you conclude?
(Multiple Choice)
4.8/5 (36)
The relative frequency of a class in a histogram is computed by
(Multiple Choice)
5.0/5 (36)
Experience shows that few students hand in their statistics exams early; most prefer to hand them in near the end of the test period.This means the time taken by students to write exams is positively skewed.
(True/False)
4.9/5 (34)
Thirty voters participating in a recent election exit poll in Alabama were asked to state their political party affiliation.Coding the data 1 for Republican,2 for Democrat,and 3 for Independent,the data collected were as follows: 3,1,2,3,1,3,3,2,1,3,3,2,1,1,3,2,3,1,3,2,3,2,1,1,3,1,2,2,1,and 3.Develop a frequency distribution and a relative frequency distribution for this data.What does the data suggest about the strength of the political parties in Alabama?
(Essay)
4.8/5 (28)
Time series data are often graphically depicted on a(n)____________________,which is a plot of the variable of interest over time.
(Short Answer)
4.9/5 (33)
The sum of relative frequencies in a distribution always equals 1.
(True/False)
4.7/5 (34)
The graphical technique used to describe the relationship between two interval variables is the scatter diagram.
(True/False)
4.8/5 (41)
Briefly explain the difference between correlation and causation in terms of a relationship between X and Y.
(Essay)
4.7/5 (36)
Which of the following statements illustrates graphical deception?
(Multiple Choice)
4.9/5 (30)
A histogram is said to be ____________________ if,when we draw a vertical line down the center of the histogram,the two sides are identical in shape and size.
(Short Answer)
4.9/5 (34)
{Teachers Ages Narrative} Draw a frequency histogram of this data which contains four classes.What is the shape of the histogram?
(Essay)
4.9/5 (40)
A professor examines the relationship between minutes studying and exam score (out of 200 points)for a random sample of his students.The scatter diagram is shown below.It appears that study time has somewhat of a positive linear relationship with exam score. 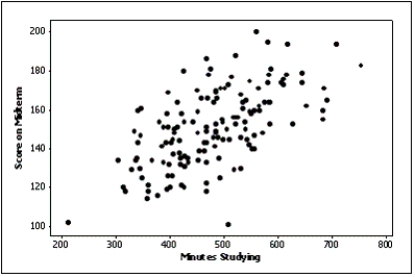
(True/False)
4.8/5 (39)
Samantha recorded her amount of exercise time (in minutes)for 100 days.Both of the line charts below were created based on her same data set.Which line chart makes her exercise times look more variable and why? 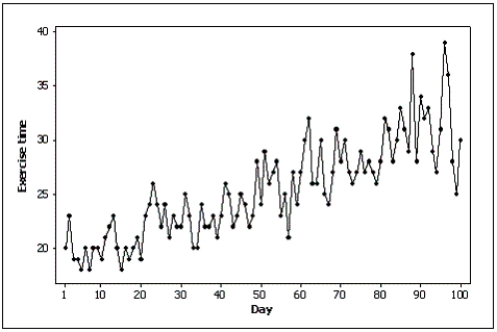
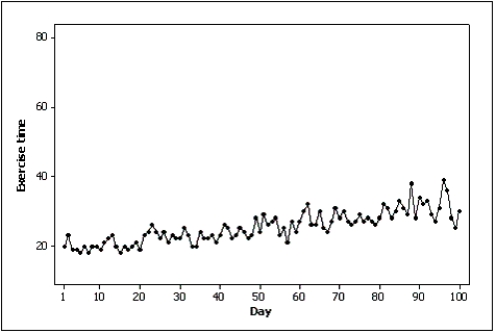
(Essay)
4.7/5 (30)
The sum of the relative frequencies for all classes in a histogram always equals
(Multiple Choice)
4.9/5 (36)
The effect of making the slope of a line chart appear steeper can be created by:
(Multiple Choice)
4.8/5 (34)
Pie charts only show ____________________,not ____________________.This means you don't know what the sample size is unless it is stated on the pie chart.
(Essay)
4.8/5 (36)
Which of the following represents a graphical presentation of interval data?
(Multiple Choice)
4.7/5 (31)
Filters
- Essay(0)
- Multiple Choice(0)
- Short Answer(0)
- True False(0)
- Matching(0)