Exam 3: Graphical Descriptive Techniques 2
Exam 1: What Is Statistics46 Questions
Exam 2: Graphical Descriptive Techniques 194 Questions
Exam 3: Graphical Descriptive Techniques 2156 Questions
Exam 4: Numerical Descriptive Techniques275 Questions
Exam 5: Data Collection and Sampling84 Questions
Exam 6: Probability240 Questions
Exam 7: Random Variables and Discrete Probability Distributions283 Questions
Exam 8: Continuous Probability Distributions224 Questions
Exam 9: Sampling Distributions156 Questions
Exam 10: Introduction to Estimation154 Questions
Exam 11: Introduction to Hypothesis Testing189 Questions
Exam 12: Inference About a Population153 Questions
Exam 13: Inference About Comparing Two Populations170 Questions
Exam 14: Analysis of Variance157 Questions
Exam 15: Chi-Squared Tests179 Questions
Exam 16: Simple Linear Regression and Correlation304 Questions
Exam 17: Multiple Regression160 Questions
Exam 18: Model Building148 Questions
Exam 19: Nonparametric Statistics175 Questions
Exam 20: Time-Series Analytics and Forecasting225 Questions
Exam 21: Statistical Process Control140 Questions
Exam 22: Decision Analysis123 Questions
Exam 23: Conclusion47 Questions
Select questions type
The techniques of shrinking the horizontal axis or stretching the vertical axis have the effect of making the slope of the graph visually (but not numerically)steeper.
(True/False)
4.9/5  (35)
(35)
The following graph shows pepper prices throughout a 12-month period. 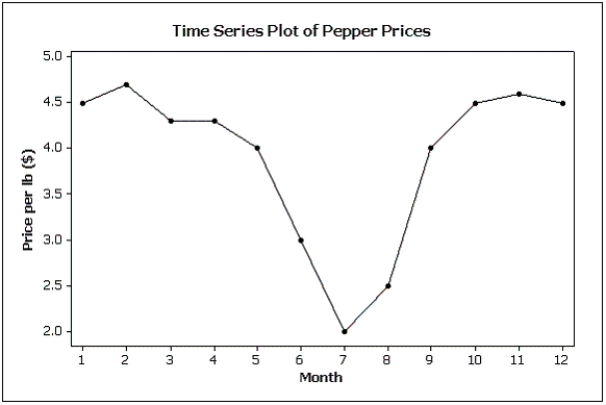 Suppose you made a new graph of the same data,where the maximum value on the Y-axis was changed from 5.0 to 10.0.(Assume everything else stays the same.) Your new graph would appear to have ____ variability in pepper prices compared to the original graph shown above.
(Multiple Choice)
4.9/5 (37)
How do you determine whether two interval variables have a positive linear relationship?
(Multiple Choice)
5.0/5 (28)
Beef prices throughout the year (month 1 = January)are shown in the line chart below (per pound).Describe beef prices for this given year using this line chart. 
(Essay)
4.8/5 (33)
Possible methods of creating distorted impressions with bar charts include:
(Multiple Choice)
4.7/5 (29)
Briefly discuss the difference between cross-sectional data and time-series data.
(Essay)
5.0/5 (34)
Which of the following characteristics apply to achieve graphical excellence?
(Multiple Choice)
4.8/5 (37)
An individual's income depends somewhat on their number of years of education.Accordingly,we identify income as the ____________________ variable,and years of education as the ____________________ variable.
(Short Answer)
4.8/5 (27)
In its 2000 report,a company presented the following data regarding its sales (in millions of dollars),and net income (in millions of dollars). 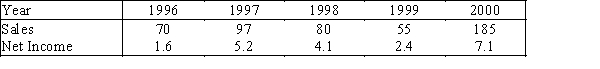 The bar chart below was used to present these data.
 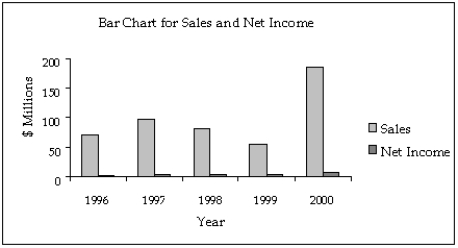 Assume that you are an unscrupulous statistician and want to make the data appear more positive than they really are.Redraw the graph by being selective about which years to include,getting the desired effect.
(Essay)
4.8/5 (24)
Electronics Company At a meeting of regional offices managers of a national electronics company,a survey was taken to determine the number of employees the regional managers supervise in the operation of their departments.The results of the survey are shown below. 
-{Electronics Company Narrative} How many regional offices are represented in the survey results?
-{Electronics Company Narrative} How many regional offices are represented in the survey results?
(Short Answer)
4.9/5 (30)
The line chart below shows cucumber prices fluctuated from $2.00 per pound to over $4.50 per pound during the year. 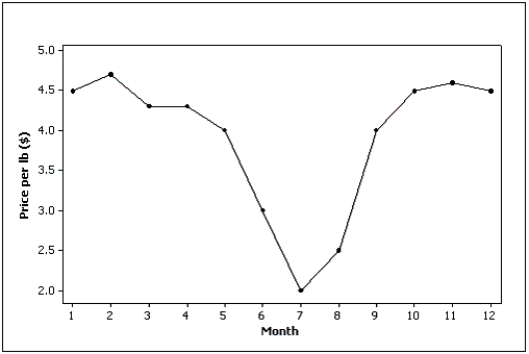
(True/False)
4.7/5 (30)
What are the two most important characteristics to look for in a scatter diagram?
(Essay)
4.9/5 (31)
Slopes and trends in a line chart appear to be steeper if you ____________________ the horizontal (time)axis.
(Short Answer)
4.8/5 (35)
The number of houses sold in Miami Springs and the average monthly mortgage rates for 18 months randomly selected between January 2011 and April 2013 are shown in the following table. 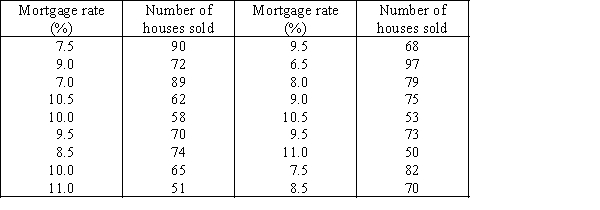
a.Draw a scatter diagram with the number of houses sold on the vertical axis.
b.Describe the relationship between mortgage rate and number of houses sold.
a.Draw a scatter diagram with the number of houses sold on the vertical axis.
b.Describe the relationship between mortgage rate and number of houses sold.
(Essay)
4.8/5 (30)
Home Care Data are collected on the number of house calls (x)made in a given week by each of 60 nurses in a certain hospital.The same data set is displayed in each of the three histograms below. 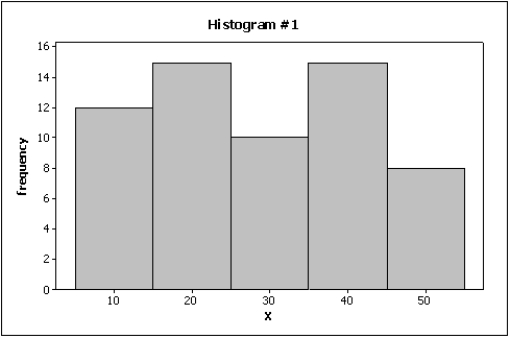
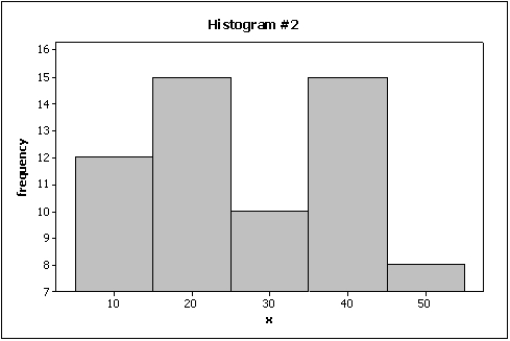
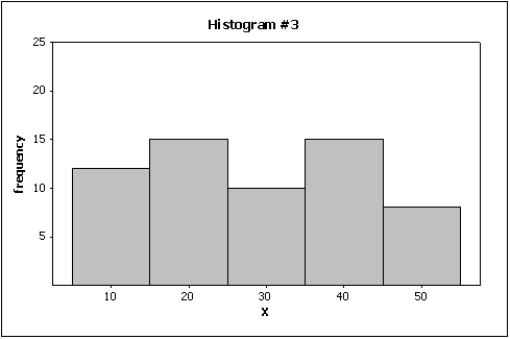
-{Home Care Narrative} Which histogram makes the differences in the house calls appear to be the most dramatic?
-{Home Care Narrative} Which histogram makes the differences in the house calls appear to be the most dramatic?
(Essay)
4.9/5 (37)
Observations that are taken during successive points in time are called ____________________ data.
(Short Answer)
4.9/5 (39)
A department store's monthly sales (in thousands of dollars)for the last year were as follows.A histogram should be used to present these data. 
(True/False)
4.8/5 (38)
The scale used on a bar chart does not affect the way the bar chart looks.
(True/False)
4.8/5 (36)
Filters
- Essay(0)
- Multiple Choice(0)
- Short Answer(0)
- True False(0)
- Matching(0)