Exam 3: Graphical Descriptive Techniques 2
Exam 1: What Is Statistics46 Questions
Exam 2: Graphical Descriptive Techniques 194 Questions
Exam 3: Graphical Descriptive Techniques 2156 Questions
Exam 4: Numerical Descriptive Techniques275 Questions
Exam 5: Data Collection and Sampling84 Questions
Exam 6: Probability240 Questions
Exam 7: Random Variables and Discrete Probability Distributions283 Questions
Exam 8: Continuous Probability Distributions224 Questions
Exam 9: Sampling Distributions156 Questions
Exam 10: Introduction to Estimation154 Questions
Exam 11: Introduction to Hypothesis Testing189 Questions
Exam 12: Inference About a Population153 Questions
Exam 13: Inference About Comparing Two Populations170 Questions
Exam 14: Analysis of Variance157 Questions
Exam 15: Chi-Squared Tests179 Questions
Exam 16: Simple Linear Regression and Correlation304 Questions
Exam 17: Multiple Regression160 Questions
Exam 18: Model Building148 Questions
Exam 19: Nonparametric Statistics175 Questions
Exam 20: Time-Series Analytics and Forecasting225 Questions
Exam 21: Statistical Process Control140 Questions
Exam 22: Decision Analysis123 Questions
Exam 23: Conclusion47 Questions
Select questions type
When a distribution has more values to the right and tails to the left,we say it is skewed negatively.
(True/False)
4.9/5  (33)
(33)
In a histogram,each observation is assigned to one or more classes.
(True/False)
4.9/5 (39)
Which of the following is a characteristic of graphical excellence?
(Multiple Choice)
4.9/5 (38)
A(n)____________________ is a graphical display consisting of a set of points,each point representing one variable measured along the horizontal axis,and another variable measured along the vertical axis.
(Short Answer)
4.8/5 (30)
We determine the approximate width of the classes by subtracting the smallest observation from the largest and dividing the answer by the number of ____________________.
(Short Answer)
4.9/5 (35)
A(n)____________________ histogram is one with a long tail extending to either the right or the left.
(Short Answer)
4.9/5 (30)
A graph of the frequency distribution for interval data is called a(n)____________________.
(Short Answer)
4.8/5 (33)
Insurance Company A representative from a local insurance agency selected a random sample of insured homeowners and recorded the number of claims made in the last three years,with the following results: 
-{Insurance Company Narrative} What proportion of homeowners had no claims in the last three years?
-{Insurance Company Narrative} What proportion of homeowners had no claims in the last three years?
(Short Answer)
4.8/5 (35)
Which of the following statements describe(s)the line chart below? 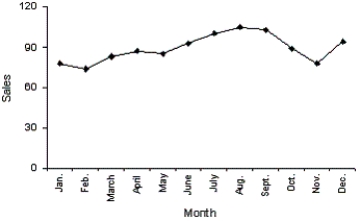
(Multiple Choice)
4.7/5 (34)
It is speculated that the number of police officers has a negative linear relationship with number of crimes.Explain why this might be so.
(Essay)
4.9/5 (30)
A(n)____________________ is a table that sorts data into class intervals (categories)and gives the number of observations in each interval (category).
(Short Answer)
4.9/5 (28)
A line chart is created by plotting the value of the variable on the ____________________ axis and the time periods on the ____________________ axis.
(Short Answer)
4.8/5 (30)
One of the variables used to help predict unemployment rates is the rate of inflation.Accordingly,we identify rate of inflation as the ____________________ variable,and unemployment rate as the ____________________ variable.
(Short Answer)
4.9/5 (40)
{Test Grade Narrative} Construct a relative frequency histogram for this data set and discuss its shape.
(Essay)
4.8/5 (39)
Filters
- Essay(0)
- Multiple Choice(0)
- Short Answer(0)
- True False(0)
- Matching(0)