Exam 26: Inferences for Regression
Exam 1: Data30 Questions
Exam 2: Displaying and Describing Categorical Data65 Questions
Exam 3: Displaying and Summarizing Quantitative Data93 Questions
Exam 4: Understanding and Comparing Distributions102 Questions
Exam 5: The Standard Deviation As a Ruler and the Normal Model131 Questions
Exam 6: Scatterplots, association, and Correlation74 Questions
Exam 7: Linear Regression57 Questions
Exam 8: Regression Wisdom32 Questions
Exam 9: Re-Expressing Data: Get It Straight51 Questions
Exam 10: Understanding Randomness26 Questions
Exam 11: Sample Surveys50 Questions
Exam 12: Experiments and Observational Surveys87 Questions
Exam 13: From Randomness to Probability64 Questions
Exam 14: Probability Rules90 Questions
Exam 15: Random Variables112 Questions
Exam 16: Probability Models114 Questions
Exam 17: Sampling Distribution Models45 Questions
Exam 18: Confidence Intervals for Proportions56 Questions
Exam 19: Testing Hypotheses About Proportions50 Questions
Exam 20: More About Tests69 Questions
Exam 21: Comparing Two Proportions52 Questions
Exam 22: Inferences About Means106 Questions
Exam 23: Comparing Means43 Questions
Exam 24: Paired Samples and Blocks33 Questions
Exam 25: Comparing Counts78 Questions
Exam 26: Inferences for Regression51 Questions
Exam 27: Analysis of Variance39 Questions
Exam 28: Multifactor Analysis of Variance22 Questions
Exam 29: Multiple Regression22 Questions
Exam 30: Multiple Regression Wisdom21 Questions
Exam 31: Rank-Based Nonparametric Tests29 Questions
Exam 32: The Bootstrap31 Questions
Select questions type
Ten students in a graduate program at the University of Toronto were randomly selected.Their grade point averages (GPAs)when they entered the program were between 3.5 and 4.0.The students' GPAs on entering the program and their current GPAs were recorded.
Dependent variable is: Current GPA
R-squared = 0.677968
S =0.024768 with 10 - 2 = 8 degrees of freedom 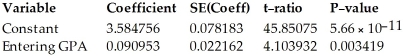
Free
(Multiple Choice)
4.8/5  (33)
(33)
Correct Answer: Verified
D
Determine which plot shows the strongest linear correlation.
Free
(Multiple Choice)
4.8/5 (30)
Correct Answer:Verified
C
The typing speeds (in words per minute)and reading speeds (in words per minute)of nine randomly selected secretaries were recorded.Use the regression analysis and summary statistics provided below to determine a 90% confidence interval for the average reading speed of a secretary whose typing speed is 71. 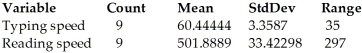 Dependent variable is: Reading speed
R-squared = 12.385%
S = 100.3348 with 9 - 2 = 7 degrees of freedom
Dependent variable is: Reading speed
R-squared = 12.385%
S = 100.3348 with 9 - 2 = 7 degrees of freedom 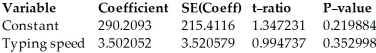
Free
(Multiple Choice)
4.8/5 (37)
Correct Answer:Verified
B
Ten students in a graduate program at the University of Toronto were randomly selected.Their grade point averages (GPAs)when they entered the program were between 3.5 and 4.0.The students' GPAs on entering the program and their current GPAs were recorded.Use the regression analysis provided below to find a 95% confidence interval for the slope of the regression line.
Dependent variable is: Current GPA
R-squared = 0.001849
S = 0.1452 with 10 - 2 = 8 degrees of freedom 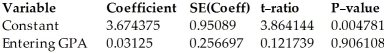
(Multiple Choice)
4.9/5 (37)
The index of exposure to radioactive waste and the cancer mortality rates (deaths per 100,000)were recorded for nine different geographic regions.Explain what the R-squared in this regression means.
Dependent variable is: Cancer Mortality Rate
R-squared = 85.8%
s = 14.00993 with 9 - 2 = 7 degrees of freedom 
(Essay)
4.7/5 (46)
A grass seed company conducts a study to determine the relationship between the density of seeds planted (in pounds per 500 sq ft)and the quality of the resulting lawn.Eight similar plots of land are selected and each is planted with a particular density of seed.One month later the quality of each lawn is rated on a scale of 0 to 100.The regression analysis and summary statistics are given below.A 99% confidence interval for the mean lawn quality of all lawns sown with a seed density of 2.9 was found to be (32.3,56.3).Give an interpretation of this interval.  Dependent variable is: Lawn Quality
R-squared = 36.0%
S = 9.073602 with 8 - 2 = 6 degrees of freedom
Dependent variable is: Lawn Quality
R-squared = 36.0%
S = 9.073602 with 8 - 2 = 6 degrees of freedom 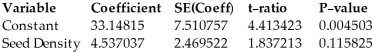
(Multiple Choice)
4.8/5 (37)
A grass seed company conducts a study to determine the relationship between the density of seeds planted (in pounds per 500 sq ft)and the quality of the resulting lawn.Eight similar plots of land are selected and each is planted with a particular density of seed.One month later the quality of each lawn is rated on a scale of 0 to 100.The regression analysis and summary statistics are given below.Determine a 99% prediction interval for the lawn quality of a lawn sown with a seed density of 1.3. 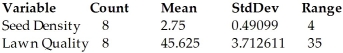 Dependent variable is: Lawn Quality
R-squared = 36.0%
S = 9.073602 with 8 - 2 = 6 degrees of freedom
Dependent variable is: Lawn Quality
R-squared = 36.0%
S = 9.073602 with 8 - 2 = 6 degrees of freedom 
(Multiple Choice)
4.9/5 (40)
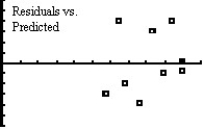
Ten students from a large lecture course were randomly sampled to see how many hours they studied for the final exam and their grade on the final exam.The professor wants to conduct a linear regression to determine if there is an association between the amount of time spent studying and the student's grade on the exam.Several plots are shown below. 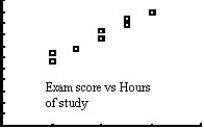
(Essay)
4.8/5 (35)
The index of exposure to radioactive waste and the cancer mortality rates (deaths per 100,000)were recorded for nine different geographic regions.Use the regression analysis and summary statistics provided below to determine a 95% prediction interval for the cancer mortality rate of a county whose index of exposure is 5.93 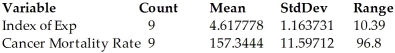 Dependent variable is: Cancer Mortality Rate
R-squared = 85.8%
S = 14.00993 with 9 - 2 = 7 degrees of freedom
Dependent variable is: Cancer Mortality Rate
R-squared = 85.8%
S = 14.00993 with 9 - 2 = 7 degrees of freedom 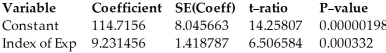
(Multiple Choice)
4.9/5 (31)
In the context of regression analysis,the sum of the residuals is always zero.
(True/False)
4.9/5 (32)
The index of exposure to radioactive waste and the cancer mortality rates (deaths per 100,000)were recorded for nine different geographic regions.A 99% confidence interval for the slope of the regression line was determined to be (4.27,14.20).Give an interpretation of this interval.
Dependent variable is: Cancer Mortality Rate
R-squared = 85.8%
S = 14.00993 with 9 - 2 = 7 degrees of freedom 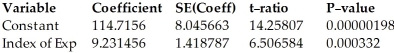
(Multiple Choice)
4.9/5 (43)
Applicants for a particular job,which involves extensive travel in Spanish-speaking countries,must take a proficiency test in Spanish.The sample data below were obtained in a study of the relationship between the numbers of years applicants have studied Spanish and their score on the test.Using a 1% level of significance,do the data provide sufficient evidence to conclude that the slope of the regression line is not 0 and hence that number of years of study is useful as a predictor of score on the test? The regression analysis is given below.
Dependent variable is: Score
R-squared = 83.0%
s = 5.65138 with 10 - 2 = 8 degrees of freedom 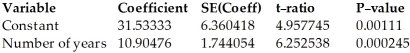
(Essay)
5.0/5 (40)
The index of exposure to radioactive waste and the cancer mortality rates (deaths per 100,000)were recorded for nine different geographic regions.
Dependent variable is: Cancer Mortality Rate
R-squared = 85.8%
S = 14.00993 with 9 - 2 = 7 degrees of freedom 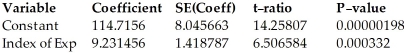
(Multiple Choice)
4.9/5 (34)
The reading speeds (in tens of words per minute)and typing speeds (in words per minute)of nine randomly selected secretaries were recorded.
Dependent variable is: Reading speed
R-squared = 97.9521%
S = 2.094847 with 9 - 2 = 7 degrees of freedom 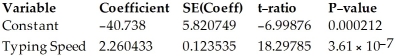
(Multiple Choice)
4.9/5 (39)
When performing regression analysis,different samples will all yield the same sample regression line.
(True/False)
4.8/5 (28)
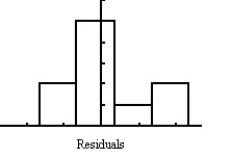
If the assumptions for regression inferences are met,what would you expect to see when constructing a residual plot and a normal probability plot for the residuals?
(Essay)
4.9/5 (28)
Applicants for a particular job,which involves extensive travel in Spanish-speaking countries,must take a proficiency test in Spanish.The sample data below were obtained in a study of the relationship between the numbers of years applicants have studied Spanish and their score on the test.A 95% prediction interval for the score of an applicant who has studied Spanish for 2.6 years was determined to be (45.7 ,74.0). 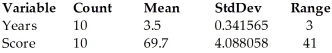 Dependent variable is: Score
R-squared = 83.0%
S = 5.65138 with 10 - 2 = 8 degrees of freedom
Dependent variable is: Score
R-squared = 83.0%
S = 5.65138 with 10 - 2 = 8 degrees of freedom 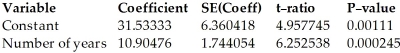
(Multiple Choice)
4.9/5 (40)
A grass seed company conducts a study to determine the relationship between the density of seeds planted (in pounds per 500 sq ft)and the quality of the resulting lawn.Eight similar plots of land are selected and each is planted with a particular density of seed.One month later the quality of each lawn is rated on a scale of 0 to 100.The regression analysis is given below.
Dependent variable is: Lawn Quality
R-squared = 36.0%
S = 9.073602 with 8 - 2 = 6 degrees of freedom 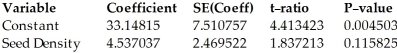
(Multiple Choice)
4.7/5 (44)
Ten students in a graduate program were randomly selected.Their grade point averages (GPAs)when they entered the program were between 3.5 and 4.0.The students' GPAs on entering the program and their current GPAs were recorded.Using a 10% level of significance,do the data below provide evidence of the conclusion that higher entering GPAs are associated with higher current GPA?
Dependent variable is: Current GPA
R-squared = 0.001849
s = 0.1452 with 10 - 2 = 8 degrees of freedom 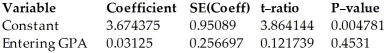
(Essay)
4.8/5 (35)
A grass seed company conducts a study to determine the relationship between the density of seeds planted (in pounds per 500 sq ft)and the quality of the resulting lawn.Eight similar plots of land are selected and each is planted with a particular density of seed.One month later the quality of each lawn is rated on a scale of 0 to 100.The regression analysis is given below.Find a 95% confidence interval for the slope of the regression line.
Dependent variable is: Lawn Quality
R-squared = 36.0%
S = 9.073602 with 8 - 2 = 6 degrees of freedom 
(Multiple Choice)
4.9/5 (34)
Filters
- Essay(0)
- Multiple Choice(0)
- Short Answer(0)
- True False(0)
- Matching(0)