Exam 30: Multiple Regression Wisdom
Exam 1: Data30 Questions
Exam 2: Displaying and Describing Categorical Data65 Questions
Exam 3: Displaying and Summarizing Quantitative Data93 Questions
Exam 4: Understanding and Comparing Distributions102 Questions
Exam 5: The Standard Deviation As a Ruler and the Normal Model131 Questions
Exam 6: Scatterplots, association, and Correlation74 Questions
Exam 7: Linear Regression57 Questions
Exam 8: Regression Wisdom32 Questions
Exam 9: Re-Expressing Data: Get It Straight51 Questions
Exam 10: Understanding Randomness26 Questions
Exam 11: Sample Surveys50 Questions
Exam 12: Experiments and Observational Surveys87 Questions
Exam 13: From Randomness to Probability64 Questions
Exam 14: Probability Rules90 Questions
Exam 15: Random Variables112 Questions
Exam 16: Probability Models114 Questions
Exam 17: Sampling Distribution Models45 Questions
Exam 18: Confidence Intervals for Proportions56 Questions
Exam 19: Testing Hypotheses About Proportions50 Questions
Exam 20: More About Tests69 Questions
Exam 21: Comparing Two Proportions52 Questions
Exam 22: Inferences About Means106 Questions
Exam 23: Comparing Means43 Questions
Exam 24: Paired Samples and Blocks33 Questions
Exam 25: Comparing Counts78 Questions
Exam 26: Inferences for Regression51 Questions
Exam 27: Analysis of Variance39 Questions
Exam 28: Multifactor Analysis of Variance22 Questions
Exam 29: Multiple Regression22 Questions
Exam 30: Multiple Regression Wisdom21 Questions
Exam 31: Rank-Based Nonparametric Tests29 Questions
Exam 32: The Bootstrap31 Questions
Select questions type
A real estate agent wishes to predict the selling price of a home based on several variables.One categorical variable of interest is the quality of the home - low,medium,or high.If the real estate agent wished to include "quality" in a regression model,how many indicator variables would he/she need to use in the model?
Free
(Multiple Choice)
4.9/5  (29)
(29)
Correct Answer: Verified
E
Here are plots for Studentized residuals against Chest. 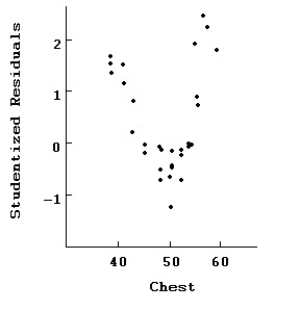 Here is the same regression with the two data points with residuals above 2 removed:
Dependent variable is: Weight
30 total bears of which 2 are missing
R-squared = 93.8% R-squared (adjusted)= 93.0%
s = 7.22 with 28 - 4 = 24 degrees of freedom
Here is the same regression with the two data points with residuals above 2 removed:
Dependent variable is: Weight
30 total bears of which 2 are missing
R-squared = 93.8% R-squared (adjusted)= 93.0%
s = 7.22 with 28 - 4 = 24 degrees of freedom 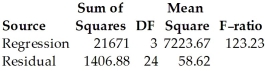
 Compare the regression with the previous one.In particular,which model is likely to make the best prediction of weight? Which seems to fit the data better?
Free
(Essay)
4.8/5 (36)
Correct Answer:Verified
Omitting the two values significantly changes the intercept.The other coefficients do not change significantly.The second regression model has a higher R-squared,suggesting that it fits the data better.Without the two outlying points,the second regression is probably the better model.
Here are plots of data for Studentized residuals against Length. 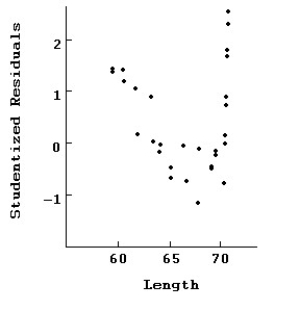 Here is the same regression with all of the points at 70 removed.
Dependent variable is: Weight
30 total bears of which 10 are missing
R-squared = 97.8% R-squared (adjusted)= 97.3%
s = 2.96 with 20 - 4 = 16 degrees of freedom
Here is the same regression with all of the points at 70 removed.
Dependent variable is: Weight
30 total bears of which 10 are missing
R-squared = 97.8% R-squared (adjusted)= 97.3%
s = 2.96 with 20 - 4 = 16 degrees of freedom 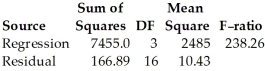
 Compare the regression with the previous one.In particular,which model is likely to make the best prediction of weight? Which seems to fit the data better?
Free
(Essay)
4.9/5 (34)
Correct Answer:Verified
Omitting the values changes the coefficients of Chest and Length significantly.Chest is no longer a large factor in weight and Length is a much larger factor.The second regression model has a higher R-squared,suggesting that it fits the data better.Without the values at 70,the second regression is probably the better model.
An actuary wishes to predict the life expectancy of a person based on several variables.One categorical variable of interest is their relationship status - single,married,divorced,widowed,or common-law.If the actuary wished to include "relationship status" in a regression model,how many indicator variables would he/she need to use in the model?
(Multiple Choice)
4.7/5 (39)
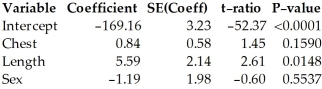
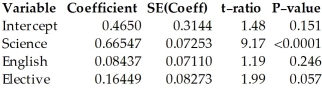
A math professor is trying to determine if her students' math grades are consistent with their grades in three other courses.She has 30 students who are all taking Math,Science,English,and an Elective course.She assigns scores of 4,3,2,and 1 for each grade of A,B,C,and D,respectively.Here's a regression model to predict the math grade based on the other courses:
Dependent variable is: Math
R-squared = 84.4% R-squared (adjusted)= 82.6%
s = 0.3789 with 30 - 4 = 26 degrees of freedom 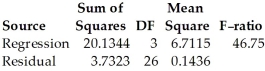
 -Here is a histogram of leverages for this regression:
 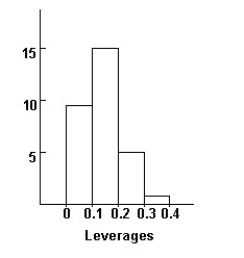 Without doing any calculating,how would you expect the coefficient and t-statistic of English to change if we were to omit the 6 highest leverage points?
(Essay)
4.8/5 (40)
Here are plots of data for Studentized residuals against Chest.  Interpret this plot of the residuals.
(Essay)
4.8/5 (42)
The manager of a human resources department wishes to predict the salary of an employee based on years of experience,x,and gender,g.(g = 1 for a male employee and 0 for a female employee).A random sample of 50 employees results in the following least-squares regression equation:  = 40,000 + 2,500 x + 1,500 g.What is the least-squares regression line for predicting the salary of male employees?
(Multiple Choice)
4.9/5 (28)
The manager of a human resources department wishes to predict the salary of an employee based on years of experience,x,and gender,g.(g = 1 for a male employee and 0 for a female employee).A random sample of 50 employees results in the following least-squares regression equation:  = 40,000 + 2,500 x + 1,500 g +1,000 xg.What is the least-squares regression line for predicting the salary of male employees?
(Multiple Choice)
4.9/5 (42)
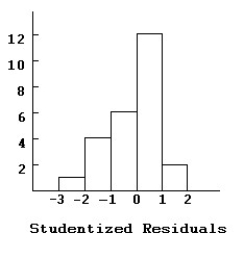
A histogram of the externally Studentized residuals looks like this: 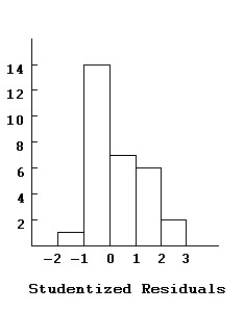 Comment on the distribution of the Studentized Residuals.
(Essay)
4.9/5 (38)
A company hired 25 employees for various positions.After the candidates were chosen,they wanted to see what the relationship of starting salary was based on years of experience and education level.They assign a 0,1,2,or 3 for high school diploma,bachelor's degree,master's degree,or a doctorate,respectively.The regression model looks like this:
Dependent variable is: Salary
R-squared = 69.6% R-squared (adjusted)= 66.9%
s = 7889 with 25 - 3 = 22 degrees of freedom 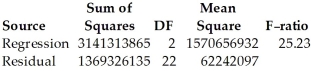
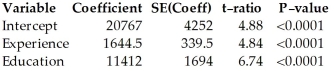 -Here are histograms of the leverage and Studentized residuals for the regression model:
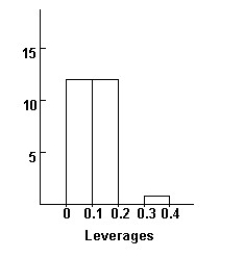
 Comment on what these diagnostic displays indicate.
(Essay)
4.8/5 (36)
The manager of a human resources department wishes to predict the salary of an employee based on years of experience,x,and gender,g.(g = 1 for a male employee and 0 for a female employee).A random sample of 50 employees results in the following least-squares regression equation:  = 40,000 + 2,500 x + 1,500 g +1,000 xg.What is the least-squares regression line for predicting the salary of female employees?
(Multiple Choice)
4.9/5 (39)
A math professor is trying to determine if her students' math grades are consistent with their grades in three other courses.She has 30 students who are all taking Math,Science,English,and an Elective course.She assigns scores of 4,3,2,and 1 for each grade of A,B,C,and D,respectively.Here's a regression model to predict the math grade based on the other courses:
Dependent variable is: Math
R-squared = 84.4% R-squared (adjusted)= 82.6%
s = 0.3789 with 30 - 4 = 26 degrees of freedom
-How would you interpret the coefficient of Science in the multiple regression?
(Essay)
4.7/5 (38)
Here are plots of data for Studentized residuals against Length.  Interpret this plot of the residuals.
(Essay)
4.8/5 (35)
The manager of a human resources department wishes to predict the salary of an employee based on years of experience,x,and gender,g.(g = 1 for a male employee and 0 for a female employee).A random sample of 50 employees results in the following least-squares regression equation:  = 40,000 + 2,500 x + 1,500 g +1,000 xg.Interpret the value of the coefficient of the interaction term xg.
(Multiple Choice)
4.9/5 (40)
The manager of a human resources department wishes to predict the salary of an employee based on years of experience,x,and gender,g.(g = 1 for a male employee and 0 for a female employee).A random sample of 50 employees results in the following least-squares regression equation:  = 40,000 + 2,500 x + 1,500 g +1,000 xg.Interpret the value of the coefficient of gender (g).
(Multiple Choice)
4.9/5 (38)
What is the purpose of an indicator variable in a regression model?
(Multiple Choice)
4.9/5 (28)
The manager of a human resources department wishes to predict the salary of an employee based on years of experience,x,and gender,g.(g = 1 for a male employee and 0 for a female employee).A random sample of 50 employees results in the following least-squares regression equation:  = 40,000 + 2,500 x + 1,500 g.What is the least-squares regression line for predicting the salary of female employees?
(Multiple Choice)
4.8/5 (35)
A math professor is trying to determine if her students' math grades are consistent with their grades in three other courses.She has 30 students who are all taking Math,Science,English,and an Elective course.She assigns scores of 4,3,2,and 1 for each grade of A,B,C,and D,respectively.Here's a regression model to predict the math grade based on the other courses:
Dependent variable is: Math
R-squared = 84.4% R-squared (adjusted)= 82.6%
s = 0.3789 with 30 - 4 = 26 degrees of freedom
-Here is the scatterplot of externally Studentized residuals against predicted values: 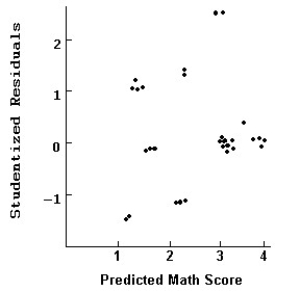 Comment on what this diagnostic display indicates.
(Essay)
4.9/5 (35)
The manager of a human resources department wishes to predict the salary of an employee based on years of experience,x,and gender,g.(g = 1 for a male employee and 0 for a female employee).A random sample of 50 employees results in the following least-squares regression equation:  = 40,000 + 2,500 x + 1,500 g +1,000 xg.Predict the salary for a male employee with 15 years of experience.
(Multiple Choice)
4.9/5 (36)
Filters
- Essay(0)
- Multiple Choice(0)
- Short Answer(0)
- True False(0)
- Matching(0)