Exam 23: Comparing Means
Exam 1: Data30 Questions
Exam 2: Displaying and Describing Categorical Data65 Questions
Exam 3: Displaying and Summarizing Quantitative Data93 Questions
Exam 4: Understanding and Comparing Distributions102 Questions
Exam 5: The Standard Deviation As a Ruler and the Normal Model131 Questions
Exam 6: Scatterplots, association, and Correlation74 Questions
Exam 7: Linear Regression57 Questions
Exam 8: Regression Wisdom32 Questions
Exam 9: Re-Expressing Data: Get It Straight51 Questions
Exam 10: Understanding Randomness26 Questions
Exam 11: Sample Surveys50 Questions
Exam 12: Experiments and Observational Surveys87 Questions
Exam 13: From Randomness to Probability64 Questions
Exam 14: Probability Rules90 Questions
Exam 15: Random Variables112 Questions
Exam 16: Probability Models114 Questions
Exam 17: Sampling Distribution Models45 Questions
Exam 18: Confidence Intervals for Proportions56 Questions
Exam 19: Testing Hypotheses About Proportions50 Questions
Exam 20: More About Tests69 Questions
Exam 21: Comparing Two Proportions52 Questions
Exam 22: Inferences About Means106 Questions
Exam 23: Comparing Means43 Questions
Exam 24: Paired Samples and Blocks33 Questions
Exam 25: Comparing Counts78 Questions
Exam 26: Inferences for Regression51 Questions
Exam 27: Analysis of Variance39 Questions
Exam 28: Multifactor Analysis of Variance22 Questions
Exam 29: Multiple Regression22 Questions
Exam 30: Multiple Regression Wisdom21 Questions
Exam 31: Rank-Based Nonparametric Tests29 Questions
Exam 32: The Bootstrap31 Questions
Select questions type
A researcher was interested in comparing the salaries of female and male employees of a particular company.Independent random samples of 8 female employees (sample 1)and 15 male employees (sample 2)yielded the following weekly salaries (in dollars).  Do the data provide sufficient evidence to conclude that the mean salary of women at this company is less than the mean salary of men at the company? Perform a t-test at the 5% significance level.
Free
(Essay)
4.9/5  (37)
(37)
Correct Answer: Verified

: 
- 
= 0 
: 
- 
< 0
Test statistic: t = -1.042
P-value = 0.1549
DF = 20.89
Do not reject  .At the 5% significance level,the data do not provide sufficient evidence to conclude that the mean salary of women at this company is less than the mean salary of men at the company.
A researcher was interested in comparing the amount of time spent watching television by women and by men.Independent random samples of 14 women and 17 men were selected and each person was asked how many hours he or she had watched television during the previous week.The summary statistics are as follows. 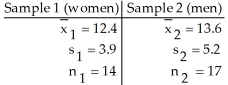 Do the data provide sufficient evidence to conclude that the mean time for women is less than the mean time for men? Perform a t-test at the 5% significance level.
Free
(Essay)
4.8/5 (37)
Correct Answer:Verified

: 
- 
= 0 
: 
- 
< 0
Test statistic: t = -0.733
P-value = 0.2347
DF = 28.79
Do not reject  .At the 5% significance level,the data do not provide sufficient evidence to conclude that the mean time for women is less than the mean time for men.
A researcher was interested in comparing the GPAs of students at the University of Toronto Scarborough and Mississauga campuses.Independent random samples of 8 students from the Scarborough campus and 13 students from the Mississauga campus yielded the following GPAs. 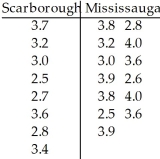 Determine a 95% confidence interval for the difference,
  -
-  ,between the mean GPA of all students at the Scarborough campus and the mean GPA of all students at the Mississauga campus.
Free
(Multiple Choice)
4.9/5 (37)
Correct Answer:Verified
E
When testing the difference between the means of a treatment group and a placebo group,the computer display below is obtained.Using a 0.05 significance level,is there sufficient evidence to support the claim that the treatment group (variable 1)represents a population whose mean is different from the mean for the untreated population? Explain. 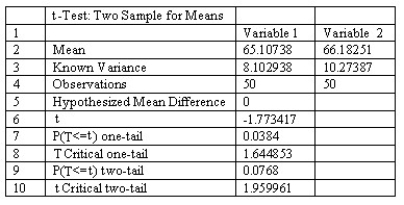
(Essay)
5.0/5 (33)
When testing the difference between the means of a treatment group and a placebo group,the computer display below is obtained.Using a 0.05 significance level,is there sufficient evidence to support the claim that the treatment group (variable 1)represents a population whose mean is different from the mean for the untreated population? Explain. 
(Essay)
4.9/5 (23)
When testing for a difference between the means of a treated population and an untreated population,the computer display below is obtained.Explain what the P-Value of 0.0316 means in this context. 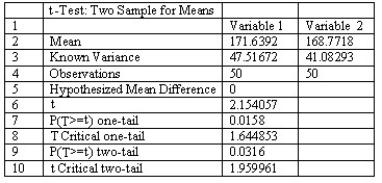
(Essay)
4.7/5 (28)
Two types of flares were tested for their burning times (in minutes).Sample results are given below. 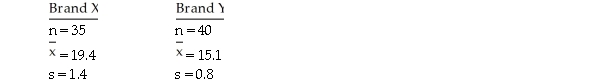 Refer to the sample data to test the claim that the two populations have unequal means.
(Essay)
4.9/5 (29)
When testing the difference between the means of a treatment group and a placebo group,the computer display below is obtained.Using a 0.01 significance level,is there sufficient evidence to support the claim that the treatment group (variable 1)represents a population whose mean is greater than the mean for the untreated population? Explain. 
(Essay)
4.9/5 (33)
You wish to construct a 90% confidence interval to compare the mean measurement for two groups.A small pilot study yields sample standard deviations of 10 and 12 for Group 1 and Group 2,respectively.If we wish to obtain a margin of error of at most 2,what sample size should we take from each group? Assume equal sample sizes.
(Multiple Choice)
4.9/5 (45)
When testing the difference between the means of a treatment group and a placebo group,the computer display below is obtained.Using a 0.05 significance level,is there sufficient evidence to support the claim that the treatment group (variable 1)represents a population whose mean is less than the mean for the untreated population? Explain. 
(Essay)
4.8/5 (30)
You wish to construct a 90% confidence interval to compare the mean measurement for two groups.A small pilot study yields sample standard deviations of 10 and 15 for Group 1 and Group 2,respectively.If we wish to obtain a margin of error of at most 3,what sample size should we take from each group? Assume equal sample sizes.
(Multiple Choice)
4.8/5 (33)
A consumer advocate decided to investigate the average wait time for a table for one at two local restaurants.Eighteen customers were sent to each restaurant at the same randomly selected times and the times they waited for a table were recorded in minutes.The following sample data was obtained. 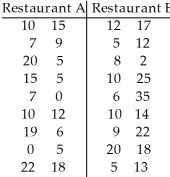 Find a 95% confidence interval for the difference,
  -
-  ,between the mean wait time at Restaurant A and the mean wait time at Restaurant B.
(Multiple Choice)
4.9/5 (39)
Researchers wanted to compare the effectiveness of a water softener used with a filtering process with a water softener used without filtering.Ninety locations were randomly divided into two groups of equal size.Group A locations used a water softener and the filtering process,while group B used only the water softener.At the end of three months,the water was tested at each location for its level of softness.(Water softness was measured on a scale of 1 to 5,with 5 being the softest water. )The results were as follows. 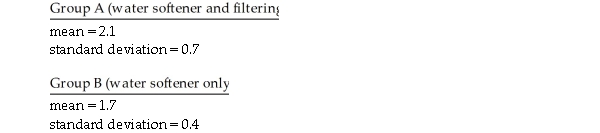 Refer to the sample data to test whether there is a difference between the two types of treatments.
(Essay)
4.8/5 (43)
83 Brand X oil filters and 79 Brand Y oil filters were tested for milligrams of residue,with the following results.Find a 95% confidence interval for  -
-  .
. 
(Multiple Choice)
4.8/5 (27)
A researcher was interested in comparing the GPAs of students at the University of Toronto Scarborough and Mississauga campuses.Independent random samples of 8 students from the Scarborough campus and 13 students from the Mississauga campus yielded the following GPAs. 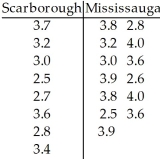 Do the data provide sufficient evidence to conclude that the mean GPA of students at the Scarborough campus differs from the mean GPA of students at the Mississauga campus? Perform a t-test at the 10% significance level.
(Essay)
4.8/5 (34)
A paint manufacturer wishes to compare the drying times of two different types of paint.Independent random samples of 11 cans of type A and 9 cans of type B were selected and applied to similar surfaces.The drying times (in minutes)were recorded.The summary statistics are as follows. 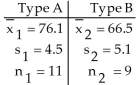 Do the data provide sufficient evidence to conclude that the mean drying time for type A differs from the mean drying time for type B? Perform a t-test at the 1% significance level.
(Essay)
4.9/5 (37)
The data below show the number of tornadoes spotted in a midwestern state in the U.S.A.annually before and after 1960.A researcher wants to determine whether there has been a change in the frequency of tornadoes in this state. 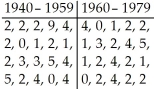
(Essay)
4.8/5 (31)
A researcher was interested in comparing the salaries of female and male employees of a particular company.Independent random samples of female employees (sample 1)and male employees (sample 2)were taken to calculate the mean salary,in dollars per week,for each group.A 98% confidence interval for the difference,  -
-  ,between the mean weekly salary of all female employees and the mean weekly salary of all male employees was determined to be (-$180,$40).
(Multiple Choice)
4.8/5 (42)
You wish to construct a 95% confidence interval to compare the mean measurement for two groups.A small pilot study yields sample standard deviations of 20 and 30 for Group 1 and Group 2,respectively.If we wish to obtain a margin of error of at most 10,what sample size should we take from each group? Assume equal sample sizes.
(Multiple Choice)
5.0/5 (35)
A researcher was interested in comparing the salaries of female and male employees of a particular company.Independent random samples of 8 female employees (sample 1)and 15 male employees (sample 2)yielded the following weekly salaries (in dollars). 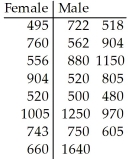 Determine a 98% confidence interval for the difference,
  -
-  ,between the mean weekly salary of all female employees and the mean weekly salary of all male employees.
(Multiple Choice)
4.8/5 (27)
Filters
- Essay(0)
- Multiple Choice(0)
- Short Answer(0)
- True False(0)
- Matching(0)