Exam 7: Linear Regression
Exam 1: Data30 Questions
Exam 2: Displaying and Describing Categorical Data65 Questions
Exam 3: Displaying and Summarizing Quantitative Data93 Questions
Exam 4: Understanding and Comparing Distributions102 Questions
Exam 5: The Standard Deviation As a Ruler and the Normal Model131 Questions
Exam 6: Scatterplots, association, and Correlation74 Questions
Exam 7: Linear Regression57 Questions
Exam 8: Regression Wisdom32 Questions
Exam 9: Re-Expressing Data: Get It Straight51 Questions
Exam 10: Understanding Randomness26 Questions
Exam 11: Sample Surveys50 Questions
Exam 12: Experiments and Observational Surveys87 Questions
Exam 13: From Randomness to Probability64 Questions
Exam 14: Probability Rules90 Questions
Exam 15: Random Variables112 Questions
Exam 16: Probability Models114 Questions
Exam 17: Sampling Distribution Models45 Questions
Exam 18: Confidence Intervals for Proportions56 Questions
Exam 19: Testing Hypotheses About Proportions50 Questions
Exam 20: More About Tests69 Questions
Exam 21: Comparing Two Proportions52 Questions
Exam 22: Inferences About Means106 Questions
Exam 23: Comparing Means43 Questions
Exam 24: Paired Samples and Blocks33 Questions
Exam 25: Comparing Counts78 Questions
Exam 26: Inferences for Regression51 Questions
Exam 27: Analysis of Variance39 Questions
Exam 28: Multifactor Analysis of Variance22 Questions
Exam 29: Multiple Regression22 Questions
Exam 30: Multiple Regression Wisdom21 Questions
Exam 31: Rank-Based Nonparametric Tests29 Questions
Exam 32: The Bootstrap31 Questions
Select questions type
A random sample of records of electricity usage of homes gives the amount of electricity used in July and size (in square feet)of 135 homes.A regression to predict the amount of electricity used (in kilowatt-hours)from size was completed.The residuals plot indicated that a linear model is appropriate.What are the variables and units in this regression?
Free
(Multiple Choice)
4.8/5  (34)
(34)
Correct Answer: Verified
A
A random sample of records of electricity usage of homes in the month of July gives the amount of electricity used and size (in square feet)of 135 homes.A regression was done to predict the amount of electricity used (in kilowatt-hours)from size.The residuals plot indicated that a linear model is appropriate.The model is  = 1,287 + 0.3 size.The people in a house that is 2,347 square feet used 500 kilowatt-hours less than expected.How much did they use?
Free
(Multiple Choice)
4.8/5 (25)
Correct Answer:Verified
A
A golf ball is dropped from 15 different heights (in cm)and the height of the bounce is recorded (in cm. )The regression analysis gives the model  = 0.4 + 0.72 drop.A golf ball dropped from 64 cm bounced 1 cm less than expected.How high did it bounce?
Free
(Multiple Choice)
4.9/5 (28)
Correct Answer:Verified
E
A sociology student does a study to determine whether people who exercise live longer.He claims that someone who exercises 7 days a week will live 15 years longer than someone who doesn't exercise at all.
(Multiple Choice)
4.7/5 (34)
A random sample of records of electricity usage of homes in the month of July gives the amount of electricity used and size (in square feet)of 135 homes.A regression was done to predict the amount of electricity used (in kilowatt-hours)from size.The residuals plot indicated that a linear model is appropriate.The model is  = 1,218 + 0.3 size.What would a negative residual mean for people living in a house that is 2,495 square feet?
(Multiple Choice)
4.8/5 (44)
The relationship between the selling price (in dollars)of used Ford Escorts and their age (in years)is analyzed.A regression analysis to predict the price from the age gives the model  = 14,458 - 1,472age.Predict the price of an Escort that is 8 years old.
(Multiple Choice)
4.9/5 (38)
The relationship between the number of games won by an NHL team and the average attendance at their home games is analyzed.A regression to predict the average attendance from the number of games won has an  = 31.4%.The residuals plot indicated that a linear model is appropriate.What is the correlation between the average attendance and the number of games won.
(Multiple Choice)
4.8/5 (46)
The relationship between the number of games won during one season by an NHL team and the average attendance at their home games is analyzed.A regression analysis to predict the average attendance from the number of games won gives the model  = -2,100 + 187 wins.Predict the average attendance of a team with 400 wins.Explain any possible problems with this prediction.
(Multiple Choice)
4.8/5 (30)
A random sample of 150 yachts sold in the Canada last year was taken.A regression analysis to predict the price (in thousands of dollars)from length (in metres)was completed.A linear model is appropriate.What are the units of the slope?
(Multiple Choice)
4.9/5 (42)
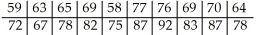
Managers rate employees according to job performance and attitude.The results for several randomly selected employees are given below. 
(Multiple Choice)
4.8/5 (35)
Ten Ford Escort classified ads were selected.The age and prices of several used Ford Escorts are given in the table. 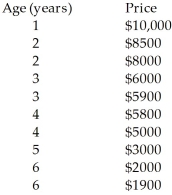
(Multiple Choice)
4.9/5 (29)
Ten students in a tutor program at Carleton University were randomly selected.Their grade point averages (GPAs)when they entered the program were less than 9.5.The following data were obtained regarding their GPAs on entering the program versus their current GPAs. 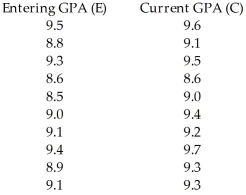
(Multiple Choice)
4.9/5 (37)
A golf ball is dropped from 15 different heights (in cm)and the height of the bounce is recorded (in cm. )The regression analysis gives the model  = 0.5 + 0.71 drop.A golf ball company is trying to show that its new ball will increase your driving distance.If the new ball is dropped from several heights would the company rather see positive or negative residuals.Explain.
(Multiple Choice)
4.9/5 (37)
The relationship between the number of games won by an NHL team and the average attendance at their home games is analyzed.A regression analysis to predict the average attendance from the number of games won gives the model  = -2,600 + 225 wins.One team averaged 14,865 fans at each game and won 49 times.Calculate the residual for this team and explain what it means.
(Multiple Choice)
4.9/5 (42)
Consider the four points (20,20), (30,50), (40,30),and (50,60).The least squares line is  = 5 + 50x.Explain what "least squares" means using these data as a specific example.
(Multiple Choice)
4.9/5 (34)
The relationship between the number of games won by an NHL team and the average attendance at their home games is analyzed.A regression analysis to predict the average attendance from the number of games won gives the model  = -3,000 + 176 wins.One team averaged 4,240 fans at each game.They won 57 times.Calculate the residual and explain what it means.
(Multiple Choice)
4.7/5 (43)
The relationship between the number of games won by an NHL team (x)and the average attendance at their home games (y)is analyzed.The mean number of games won was 70 with a standard deviation of 16.The mean attendance was 6,993 with a standard deviation of 1,400.The correlation between the games won and attendance was 0.47.
(Multiple Choice)
4.9/5 (37)
Filters
- Essay(0)
- Multiple Choice(0)
- Short Answer(0)
- True False(0)
- Matching(0)