Exam 28: Multifactor Analysis of Variance
Exam 1: Data30 Questions
Exam 2: Displaying and Describing Categorical Data65 Questions
Exam 3: Displaying and Summarizing Quantitative Data93 Questions
Exam 4: Understanding and Comparing Distributions102 Questions
Exam 5: The Standard Deviation As a Ruler and the Normal Model131 Questions
Exam 6: Scatterplots, association, and Correlation74 Questions
Exam 7: Linear Regression57 Questions
Exam 8: Regression Wisdom32 Questions
Exam 9: Re-Expressing Data: Get It Straight51 Questions
Exam 10: Understanding Randomness26 Questions
Exam 11: Sample Surveys50 Questions
Exam 12: Experiments and Observational Surveys87 Questions
Exam 13: From Randomness to Probability64 Questions
Exam 14: Probability Rules90 Questions
Exam 15: Random Variables112 Questions
Exam 16: Probability Models114 Questions
Exam 17: Sampling Distribution Models45 Questions
Exam 18: Confidence Intervals for Proportions56 Questions
Exam 19: Testing Hypotheses About Proportions50 Questions
Exam 20: More About Tests69 Questions
Exam 21: Comparing Two Proportions52 Questions
Exam 22: Inferences About Means106 Questions
Exam 23: Comparing Means43 Questions
Exam 24: Paired Samples and Blocks33 Questions
Exam 25: Comparing Counts78 Questions
Exam 26: Inferences for Regression51 Questions
Exam 27: Analysis of Variance39 Questions
Exam 28: Multifactor Analysis of Variance22 Questions
Exam 29: Multiple Regression22 Questions
Exam 30: Multiple Regression Wisdom21 Questions
Exam 31: Rank-Based Nonparametric Tests29 Questions
Exam 32: The Bootstrap31 Questions
Select questions type
A student runs an experiment to study the effect of gas brand and car type on mileage.She uses 3 different brands of gas on 8 different types of cars.
Free
(Multiple Choice)
4.8/5  (29)
(29)
Correct Answer: Verified
E
The following ANOVA table shows the results of an experiment used to test the effect of car type and gas brand on mileage.In the experiment 4 different types of cars and 3 different brands of gas were used.Assuming no effect from the interaction between car and brand of gas,test the claim that the four cars have the same mean mileage. 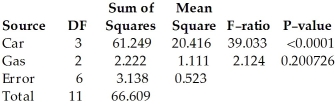
Free
(Essay)
4.8/5 (35)
Correct Answer:Verified

: 
= 
= 
= 
,where γ represents the effect of the type of car vs.  : Not all of the car types have the same effect.The null hypothesis states that the type of car has no effect on gas mileage.The alternative states that it does.The P-value for car type is <0.0001,so it appears that the different types of cars do not have the same mean mileage.
A student runs an experiment on test scores for males and females at different times of day.She uses 4 different times of day.
Free
(Multiple Choice)
4.9/5 (36)
Correct Answer:Verified
A
A student runs a two-factor experiment to test how toaster level and speed affect the level of crispness of a bagel.He choses 3 levels of crispness (light,medium,dark)and 3 speeds (1 min,2 min,3 min),toasting one bagel at each condition.
(Essay)
4.8/5 (37)
The following ANOVA table shows the results of an experiment used to test the effect of car type and gas brand on mileage.In the experiment 4 different types of cars and 3 different brands of gas were used.Assuming no effect from the interaction between car and brand of gas,test the claim that the three brands of gas provide the same mean gas mileage. 
(Essay)
4.8/5 (39)
A student runs an experiment to study the effect of gas brand and car type on mileage.She uses 3 different brands of gas on 4 different types of cars.
(Essay)
4.7/5 (39)
The following ANOVA table shows the results of an experiment used to test how race car drivers and different tracks affect time.The experiment used 3 different drivers on 4 different tracks.Assuming no effect from the interaction between driver and track,test the claim that the three drivers have the same mean time. 
(Essay)
4.8/5 (41)
The following data shows the yield,in bushels per acre,categorized according to three varieties of corn and three different soil conditions (Plot 1,Plot 2,and Plot 3).Test the null hypothesis of no interaction between variety and soil conditions at a significance level of 0.05. 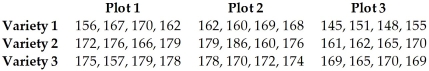
(Essay)
4.8/5 (30)
The following ANOVA table shows the results of an experiment used to test scores for males and females at 4 different times of day.Assuming no effect from the interaction between gender and test time,test the claim that time of day does not affect test scores. 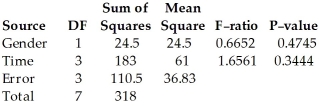
(Essay)
4.8/5 (38)
The following data shows annual income,in thousands of dollars,categorized according to the two factors of gender and level of education.Assume that incomes are not affected by an interaction between gender and level of education,and test the null hypothesis that gender has no effect on income and that level of education has no effect on income.Use a 0.05 significance level. 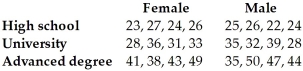
(Essay)
4.9/5 (38)
The following ANOVA table shows the results of an experiment used to test how race car drivers and different tracks affect time.The experiment used 3 different drivers on 4 different tracks.Assuming no effect from the interaction between driver and track,test the claim that the track has no effect on time. 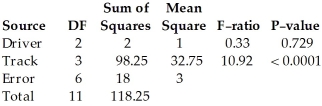
(Essay)
4.9/5 (33)
A student runs an experiment to study the effect that a teacher has based on the size of their class.She uses 3 different teachers on 5 different class sizes.
(Essay)
4.8/5 (36)
A student runs an experiment to test how race car drivers and different tracks affect time.He uses 3 different drivers on 4 different tracks.He randomizes the trials,performing 4 runs under each treatment condition,carefully recording how many laps each driver completes on each different track.
(Essay)
4.9/5 (42)
The following data shows the yield,in bushels per acre,categorized according to three varieties of corn and three different soil conditions (Plot 1,Plot 2,and Plot 3).Assume that yields are not affected by an interaction between variety and soil conditions,and test the null hypothesis that variety has no effect on yield and that soil conditions have no effect on yield.Use a 0.05 significance level. 
(Essay)
4.8/5 (33)
A student runs an experiment to study the effect that a teacher has based on the size of their class.She uses 3 different teachers on 6 different class sizes.
(Multiple Choice)
4.9/5 (34)
The following ANOVA table shows the results of an experiment used to test scores for males and females at 4 different times of day.Assuming no effect from the interaction between gender and test time,test the claim that males and females perform the same on the test. 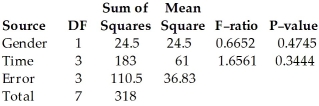
(Essay)
4.8/5 (37)
The following ANOVA table shows the results of a study in which three different teachers taught calculus classes of five different sizes.The class average was recorded for each class.Assuming no effect from the interaction between teacher and class size,test the claim that the teacher has no effect on the class average. 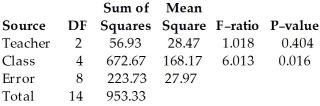
(Essay)
4.8/5 (36)
A student runs a two-factor experiment to test how toaster level and speed affect the level of crispness of a bagel.He choses 3 levels of crispness (light,medium,dark)and 3 speeds (1 min,2 min,3 min),toasting one bagel at each condition.
(Multiple Choice)
4.9/5 (27)
A student runs an experiment on test scores for males and females at different times of day.She uses 4 different times of day.
(Essay)
4.8/5 (31)
The following ANOVA table shows the results of a study in which three different teachers taught calculus classes of five different sizes.The class average was recorded for each class.Assuming no effect from the interaction between teacher and class size,test the claim that the teacher has no effect on the class average. 
(Essay)
4.9/5 (34)
Filters
- Essay(0)
- Multiple Choice(0)
- Short Answer(0)
- True False(0)
- Matching(0)