Exam 32: The Bootstrap
Exam 1: Data30 Questions
Exam 2: Displaying and Describing Categorical Data65 Questions
Exam 3: Displaying and Summarizing Quantitative Data93 Questions
Exam 4: Understanding and Comparing Distributions102 Questions
Exam 5: The Standard Deviation As a Ruler and the Normal Model131 Questions
Exam 6: Scatterplots, association, and Correlation74 Questions
Exam 7: Linear Regression57 Questions
Exam 8: Regression Wisdom32 Questions
Exam 9: Re-Expressing Data: Get It Straight51 Questions
Exam 10: Understanding Randomness26 Questions
Exam 11: Sample Surveys50 Questions
Exam 12: Experiments and Observational Surveys87 Questions
Exam 13: From Randomness to Probability64 Questions
Exam 14: Probability Rules90 Questions
Exam 15: Random Variables112 Questions
Exam 16: Probability Models114 Questions
Exam 17: Sampling Distribution Models45 Questions
Exam 18: Confidence Intervals for Proportions56 Questions
Exam 19: Testing Hypotheses About Proportions50 Questions
Exam 20: More About Tests69 Questions
Exam 21: Comparing Two Proportions52 Questions
Exam 22: Inferences About Means106 Questions
Exam 23: Comparing Means43 Questions
Exam 24: Paired Samples and Blocks33 Questions
Exam 25: Comparing Counts78 Questions
Exam 26: Inferences for Regression51 Questions
Exam 27: Analysis of Variance39 Questions
Exam 28: Multifactor Analysis of Variance22 Questions
Exam 29: Multiple Regression22 Questions
Exam 30: Multiple Regression Wisdom21 Questions
Exam 31: Rank-Based Nonparametric Tests29 Questions
Exam 32: The Bootstrap31 Questions
Select questions type
Two brands of flares - Brand 1 and Brand 2 - are tested for their burning times (in minutes).A random sample of 40 of each brand of flare are burned and timed.In order to compute a bootstrap confidence interval for the difference in population means,400 subsequent bootstrap samples were taken and the resulting values of  *-
*-  * were are ordered from lowest to highest.The first 10 and last 10 ordered values of
  *-
*-  * are given below:
  Use the percentile method to compute a 95% bootstrap confidence interval for the true difference in the average burning time (Brand 1 - Brand 2).
Free
(Multiple Choice)
4.8/5  (31)
(31)
Correct Answer: Verified
D
A random sample of 100 students were randomly selected from your school and their average grade was recorded,as a percentage,for the 2010/2011 school year.In order to compute a bootstrap confidence interval for the mean,200 subsequent bootstrap samples were taken and the 200 resulting sample means were ordered from lowest to highest.The first 10 and last 10 ordered means are given below:  Use the percentile method to compute a 95% bootstrap confidence interval for the true average grade of all students at your school.
Free
(Multiple Choice)
4.7/5 (41)
Correct Answer:Verified
D
When using bootstrapping to estimate the standard error of a statistic,what is the minimum number of resamples required (according to the textbook)?
Free
(Multiple Choice)
4.9/5 (38)
Correct Answer:Verified
E
Consider the following sample of three measurements {4,8,13}.Which of the following distinct resamples is least likely to occur?
(Multiple Choice)
4.8/5 (33)
Consider the following sample of four measurements {2,5,11,14}.Five bootstrap samples of this sample produced the following resamples: {2,5,5,14},{5,11,11,11},{2,11,14,14},{2,2,14,14},
{5,5,11,14}.Based on these five resamples,find the bootstrap of the standard error of the sample mean.
(Multiple Choice)
4.8/5 (31)
Consider the following sample of three measurements {4,8,13}.What is the probability of observing the distinct resample {4,8,8}?
(Multiple Choice)
4.9/5 (33)
Consider the following sample of three measurements {1,2,3,4}.Which of the following distinct resamples is least likely to occur?
(Multiple Choice)
4.9/5 (43)
A researcher was interested in comparing the GPAs of students at the University of Toronto Scarborough and Mississauga campuses.Independent random samples of 8 students from the Scarborough campus and 13 students from the Mississauga campus yielded the following GPAs. 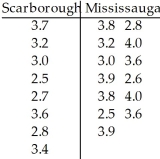 Use software to bootstrap the standard error of the difference in sample medians based on 200 resamples.
(Not Answered)
This question doesn't have any answer yet
A random sample of 50 adult men in Toronto were randomly selected in order to investigate the correlation between their heights and weights.In order to compute a bootstrap confidence interval for the difference in population means,280 subsequent bootstrap samples were taken and the resulting values of the sample correlation were are ordered from lowest to highest.The first 10 and last 10 ordered values of sample correlation are given below:  Use the percentile method to compute a 95% bootstrap confidence interval for the true correlation between the heights and weights of adult men in Toronto.
(Multiple Choice)
4.8/5 (35)
Consider the following sample of three measurements {1,2,3,4}.How many distinct resamples are possible?
(Multiple Choice)
4.8/5 (35)
A random sample of 100 students were randomly selected from your school and their average grade was recorded,as a percentage,for the 2010/2011 school year.In order to compute a bootstrap confidence interval for the mean,200 subsequent bootstrap samples were taken and the 200 resulting sample means were ordered from lowest to highest.The first 10 and last 10 ordered means are given below: 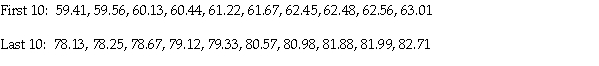 Use the percentile method to compute a 90% bootstrap confidence interval for the true average grade of all students at your school.
(Multiple Choice)
4.8/5 (38)
Consider the following sample of three measurements {4,8,13}.What is the probability of observing the distinct resample {8,8,8}?
(Multiple Choice)
4.7/5 (32)
Consider the following sample of three measurements {4,8,13}.What is the probability of observing the distinct resample {4,8,13}?
(Multiple Choice)
4.7/5 (38)
Consider the following sample of three measurements {4,8,13}.Five bootstrap samples of this sample produced the following resamples: {4,8,8},{4,4,13},{4,8,13},{8,8,8},{8,13,13}.Based on these five resamples,find the bootstrap of the standard error of the sample mean.
(Multiple Choice)
4.8/5 (42)
Consider the following sample of four measurements {2,5,11,14}.Five bootstrap samples of this sample produced the following resamples: {2,5,5,14},{5,11,11,11},{2,11,14,14},{2,2,14,14},
{5,5,11,14}.Based on these five resamples,find the bootstrap of the standard error of the sample median.
(Multiple Choice)
4.8/5 (34)
Two brands of flares - Brand 1 and Brand 2 - are tested for their burning times (in minutes).A random sample of 40 of each brand of flare are burned and timed,and the difference in sample means is found to be  -
-  = 4.3.Ten subsequent bootstrap samples from each of these original samples yield the following values of
  *-
*-  *:
5.8,1.7,2.9,4.9,6.1,5.2,7.0,5.5,4.6,3.3.Based on these ten values,find the bootstrap of the standard error of
*:
5.8,1.7,2.9,4.9,6.1,5.2,7.0,5.5,4.6,3.3.Based on these ten values,find the bootstrap of the standard error of  -
-  .
.
(Multiple Choice)
5.0/5 (40)
A researcher was interested in comparing the salaries of female and male employees of a particular company.Independent random samples of 8 female employees (sample 1)and 15 male employees (sample 2)yielded the following weekly salaries (in dollars). 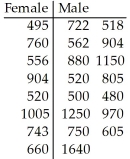 Use software to compute a 95% bootstrap confidence interval for the difference in sample medians based on 1000 resamples.
(Not Answered)
This question doesn't have any answer yet
A random sample of 50 students were randomly selected from your campus.Each student was asked to record their income and their average grade,as a percentage,for the 2010/2011 school year.The sample correlation coefficient was found to be -0.43.Ten subsequent bootstrap samples based on this initial sample produced the following correlation coefficients: -0.51,-0.33,-0.42,-0.45,-0.48,-0.44,-0.48,-0.56,-0.38,-0.39.Based on these ten resamples,find the bootstrap of the standard error of the sample correlation.
(Multiple Choice)
4.8/5 (28)
A grocery store manager is interested in determining whether or not a difference exists between the shelf life of two different brands of doughnuts.A random sample of 100 boxes of each brand was selected and the shelf life in days was determined for each box.The difference in sample means is found to be  -
-  = 0.8.Ten subsequent bootstrap samples from each of these original samples yield the following values of
  *-
*-  *: 1.8,2.7,-1.9,2.1,0.1,-0.5,-2.3,1.2,2.1,-1.0.Based on these ten values,find the bootstrap of the standard error of
  -
-  .
.
(Multiple Choice)
4.9/5 (36)
A random sample of 100 adult men in Toronto were randomly selected.The sample correlation between their heights and weights was found to be 0.62.Ten subsequent bootstrap samples based on this initial sample produced the following correlation coefficients: 0.58,0.52,0.67,0.62,0.63,0.54,0.71,0.66,0.58,0.70.Based on these ten resamples,find the bootstrap of the standard error of the sample correlation.
(Multiple Choice)
4.8/5 (39)
Filters
- Essay(0)
- Multiple Choice(0)
- Short Answer(0)
- True False(0)
- Matching(0)