Exam 9: Re-Expressing Data: Get It Straight
Exam 1: Data30 Questions
Exam 2: Displaying and Describing Categorical Data65 Questions
Exam 3: Displaying and Summarizing Quantitative Data93 Questions
Exam 4: Understanding and Comparing Distributions102 Questions
Exam 5: The Standard Deviation As a Ruler and the Normal Model131 Questions
Exam 6: Scatterplots, association, and Correlation74 Questions
Exam 7: Linear Regression57 Questions
Exam 8: Regression Wisdom32 Questions
Exam 9: Re-Expressing Data: Get It Straight51 Questions
Exam 10: Understanding Randomness26 Questions
Exam 11: Sample Surveys50 Questions
Exam 12: Experiments and Observational Surveys87 Questions
Exam 13: From Randomness to Probability64 Questions
Exam 14: Probability Rules90 Questions
Exam 15: Random Variables112 Questions
Exam 16: Probability Models114 Questions
Exam 17: Sampling Distribution Models45 Questions
Exam 18: Confidence Intervals for Proportions56 Questions
Exam 19: Testing Hypotheses About Proportions50 Questions
Exam 20: More About Tests69 Questions
Exam 21: Comparing Two Proportions52 Questions
Exam 22: Inferences About Means106 Questions
Exam 23: Comparing Means43 Questions
Exam 24: Paired Samples and Blocks33 Questions
Exam 25: Comparing Counts78 Questions
Exam 26: Inferences for Regression51 Questions
Exam 27: Analysis of Variance39 Questions
Exam 28: Multifactor Analysis of Variance22 Questions
Exam 29: Multiple Regression22 Questions
Exam 30: Multiple Regression Wisdom21 Questions
Exam 31: Rank-Based Nonparametric Tests29 Questions
Exam 32: The Bootstrap31 Questions
Select questions type
For the model  = 2.72 + 2.3x,predict y when x = 5.Round to two decimal places.
Free
(Multiple Choice)
4.9/5  (37)
(37)
Correct Answer: Verified
A
Use technology to create a curved model for the data. 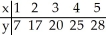
Free
(Essay)
4.7/5 (40)
Correct Answer:Verified
 = 7.19 + 12.8 ln x
A university radio station has been airing a public service announcement (PSA)that gives a telephone number students can call to get information on upcoming campus events.In order to determine the optimal number of times per day to run the PSA,the station has been counting the number of calls generated each day as a function of the number of times the PSA was aired.The results of the experiment are summarized in the table below. 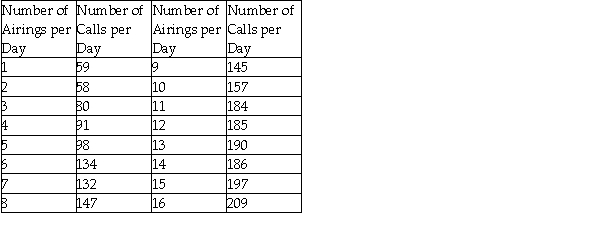 a)Re-express the data by squaring the number of calls per day,then plot the re-expressed data as a scatterplot.
 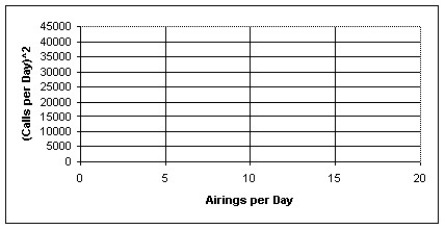 b)Determine the regression equation and correlation coefficient for the re-expressed data.
c)Interpret the slope of your model.Comment on the meaning and usefulness of this slope.
b)Determine the regression equation and correlation coefficient for the re-expressed data.
c)Interpret the slope of your model.Comment on the meaning and usefulness of this slope.
Free
(Essay)
4.8/5 (40)
Correct Answer:Verified
a) 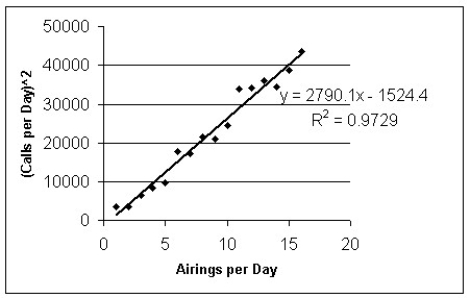
b)y = 2790.1x - 1524.4,R = 0.9864
c)The slope from the model is equal to 2790.1.The units are
(calls per day)2 per (airings per day),which means that the square of the number of daily calls goes up 2790.1 for every additional airing per day.Taking the square root of this slope gives 52.8 calls per day per (airings per day)1/2.Neither quantity is of very much use.
A company manufactures of polypropylene rope in six different sizes.To assess the strength of the ropes they test two samples of each size to see how much force (in kilograms)the ropes will hold without breaking.The table shows the results of the tests.We want to create a model for predicting the breaking strength from the diameter of the rope.Use technology to create a curved model for the data. 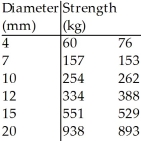
(Essay)
4.9/5 (39)
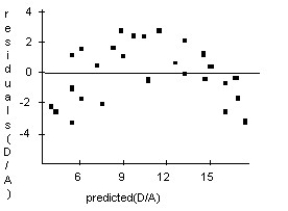
The relationship between two quantities X and Y is examined,and the association is shown in the scatterplot below.  What re-expression of Y should be tried as a starting point?
(Multiple Choice)
5.0/5 (30)
One of the important factors determining a car's fuel efficiency is its weight.This relationship is examined for 11 cars,and the association is shown in the scatterplot below. 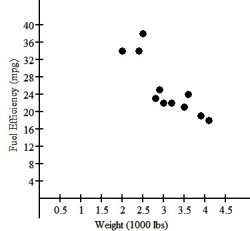 If a linear model is considered,the regression analysis is as follows:
Dependent variable: MPG
R-squared = 84.7%
VARIABLE COEFFICIENT
Intercept 47.1181
Weight -7.34614
The residuals plot is:
If a linear model is considered,the regression analysis is as follows:
Dependent variable: MPG
R-squared = 84.7%
VARIABLE COEFFICIENT
Intercept 47.1181
Weight -7.34614
The residuals plot is: 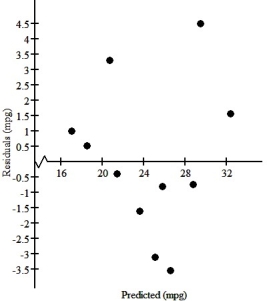 Based upon the residuals plot,do you think that this linear model is appropriate?
(Multiple Choice)
4.8/5 (32)
A forester would like to know how big a maple tree might be at age 50 years.She gathers data from some trees that have been cut down,and plots the diameters (in inches)of the trees against their ages (in years).First she makes a linear model.The scatterplot and residuals plot are shown.Describe the association shown in the scatterplot. 
(Essay)
4.8/5 (39)
For the model  = 4.3 + 0.1x,predict y when x = 5.Round to two decimal places.
(Multiple Choice)
4.7/5 (32)
For the model  = 2.8
= 2.8  ,predict y when x = 4.Round to two decimal places.
(Multiple Choice)
4.8/5 (35)
For the model  = 0.1
= 0.1  + 2.1x + 8,predict y when x = 3.Round to two decimal places.
(Multiple Choice)
4.8/5 (43)
One of the important factors determining a car's fuel efficiency is its weight.This relationship is examined for 11 cars,and the association is shown in the scatterplot below. 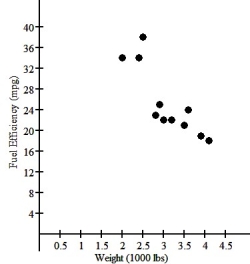 If a linear model is considered,the regression analysis is as follows:
Dependent variable: MPG
R-squared = 84.7%
VARIABLE COEFFICIENT
Intercept 47.1181
Weight -7.34614
What does the slope say about this relationship?
If a linear model is considered,the regression analysis is as follows:
Dependent variable: MPG
R-squared = 84.7%
VARIABLE COEFFICIENT
Intercept 47.1181
Weight -7.34614
What does the slope say about this relationship?
(Multiple Choice)
4.8/5 (38)
For the model  = 1.4 + 0.08 log x,predict y when x = 2.Round to two decimal places.
(Multiple Choice)
4.8/5 (31)
A forester would like to know how big a maple tree might be at age 50 years.She gathers data from some trees that have been cut down,and plots the diameters (in inches)of the trees against their ages (in years).First she makes a linear model.The scatterplot and residuals plot are shown.Do you think the linear model is appropriate? Explain. 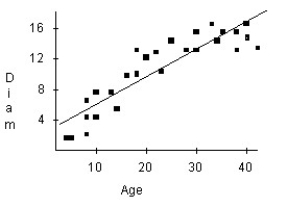

(Essay)
4.8/5 (38)
The relationship between two quantities X and Y is examined,and the association is shown in the scatterplot below. 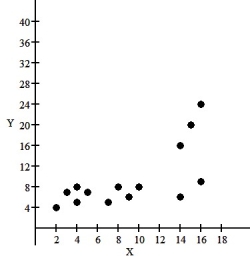 Should you re-express these data before trying to fit a model? Explain.
(Multiple Choice)
4.8/5 (38)
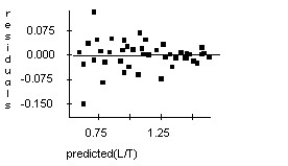
Doctors studying how the human body assimilates medication inject some patients with penicillin,and then monitor the concentration of the drug (in units/cc)in the patients' blood for seven hours.The data are shown in the scatterplot.First they tried to fit a linear model.Now the researchers try a new model,using the re-expression log(Concentration).Examine the regression analysis and the residuals plot below.Explain why you think this model is better than the original linear model. 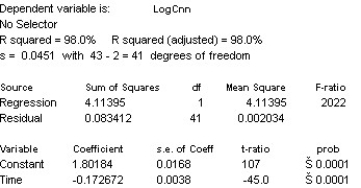
(Essay)
4.9/5 (33)
Doctors studying how the human body assimilates medication inject a patient with penicillin,and then monitor the concentration of the drug in the patient's blood for several hours.The data are shown in the table. 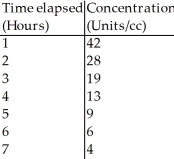 Use your model to estimate what the concentration of penicillin will be after 8 hours.
(Essay)
4.7/5 (31)
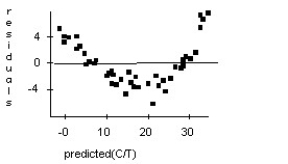
Doctors studying how the human body assimilates medication inject some patients with penicillin,and then monitor the concentration of the drug (in units/cc)in the patients' blood for seven hours.The data are shown in the scatterplot.First they tried to fit a linear model.The regression analysis and residuals plot are shown.Is that estimate likely to be accurate,too low,or too high? Explain. 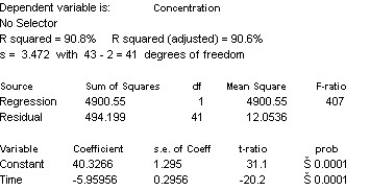
(Essay)
5.0/5 (34)
The consumer price index (CPI)is a measure of the relative cost of goods in a country for a particular year.The table below shows the CPI for various years beginning in 1940. 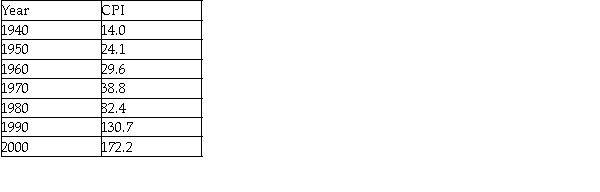 a)Re-express the CPI by taking the log of the data,then plot the re-expressed data as a scatterplot.
 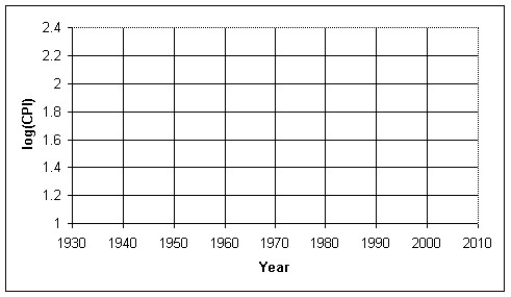 b)Determine the regression equation and correlation coefficient for the re-expressed data.
c)Use your model from part (b)to predict the CPI in 2010.
b)Determine the regression equation and correlation coefficient for the re-expressed data.
c)Use your model from part (b)to predict the CPI in 2010.
(Essay)
4.9/5 (33)
For the model  = 1.77 + 1.6x,predict y when x = 2.Round to two decimal places.
(Multiple Choice)
4.8/5 (31)
Filters
- Essay(0)
- Multiple Choice(0)
- Short Answer(0)
- True False(0)
- Matching(0)