Exam 3: Displaying and Summarizing Quantitative Data
Exam 1: Data30 Questions
Exam 2: Displaying and Describing Categorical Data65 Questions
Exam 3: Displaying and Summarizing Quantitative Data93 Questions
Exam 4: Understanding and Comparing Distributions102 Questions
Exam 5: The Standard Deviation As a Ruler and the Normal Model131 Questions
Exam 6: Scatterplots, association, and Correlation74 Questions
Exam 7: Linear Regression57 Questions
Exam 8: Regression Wisdom32 Questions
Exam 9: Re-Expressing Data: Get It Straight51 Questions
Exam 10: Understanding Randomness26 Questions
Exam 11: Sample Surveys50 Questions
Exam 12: Experiments and Observational Surveys87 Questions
Exam 13: From Randomness to Probability64 Questions
Exam 14: Probability Rules90 Questions
Exam 15: Random Variables112 Questions
Exam 16: Probability Models114 Questions
Exam 17: Sampling Distribution Models45 Questions
Exam 18: Confidence Intervals for Proportions56 Questions
Exam 19: Testing Hypotheses About Proportions50 Questions
Exam 20: More About Tests69 Questions
Exam 21: Comparing Two Proportions52 Questions
Exam 22: Inferences About Means106 Questions
Exam 23: Comparing Means43 Questions
Exam 24: Paired Samples and Blocks33 Questions
Exam 25: Comparing Counts78 Questions
Exam 26: Inferences for Regression51 Questions
Exam 27: Analysis of Variance39 Questions
Exam 28: Multifactor Analysis of Variance22 Questions
Exam 29: Multiple Regression22 Questions
Exam 30: Multiple Regression Wisdom21 Questions
Exam 31: Rank-Based Nonparametric Tests29 Questions
Exam 32: The Bootstrap31 Questions
Select questions type
The following stem-and-leaf display shows the number of homeless cats and dogs that had to be euthanized each year in a large city for the period 1985-2004. 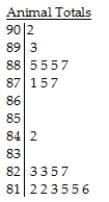 Key:
87 | 5 = 87,500 cats and dogs euthanized
Key:
87 | 5 = 87,500 cats and dogs euthanized
Free
(Multiple Choice)
4.8/5  (35)
(35)
Correct Answer: Verified
C
John liked to order the all-you-can-eat shrimp at his favorite restaurant.Here are the number of shrimp he ate during his last five visits to the restaurant.
15,16,13,15,10
Free
(Multiple Choice)
4.7/5 (24)
Correct Answer:Verified
C
A store manager kept track of the number of newspapers sold each week.The results are shown below. 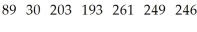
Free
(Multiple Choice)
4.8/5 (36)
Correct Answer:Verified
B
Here are summary statistics of the four last digits of social security number of 500 customers,corresponding to the following histogram. 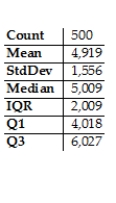
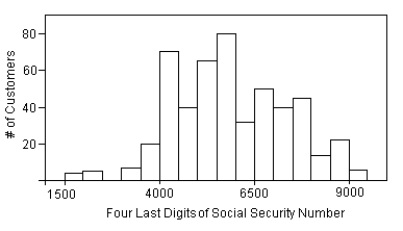 Is the mean or median a "better" summary of the centre of the distribution?
(Multiple Choice)
4.9/5 (42)
Here are the number of hours that Bill has exercised each week since he started keeping records.  Round your answer to the nearest tenth.
(Multiple Choice)
4.8/5 (27)
A small company employs a supervisor at $1,400 a week,an inventory manager at $800 a week,8 stock boys at $300 a week each,and 6 drivers at $700 a week each.
(Multiple Choice)
4.8/5 (36)
The diastolic blood pressures,in mm Hg,for a sample of patients at a clinic are given.Create a stem-and-leaf display of the data.Do not use split stems. 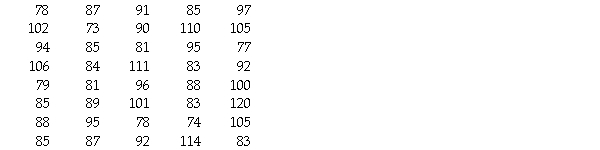
(Essay)
4.7/5 (40)
The histogram shows the sizes (in acres)of 169 farms in Ontario.In addition to describing the distribution,approximate the percentage of farms that are under 100 acres. 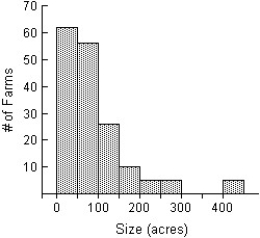
(Multiple Choice)
4.8/5 (38)
The weights,in kilograms,of 17 randomly selected adults are given below.Find the interquartile range (IQR)by hand. 
(Multiple Choice)
5.0/5 (28)
Here are the average mathematics achievement scores for ninth graders in 34 counties.Find the standard deviation. 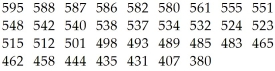
(Multiple Choice)
4.8/5 (29)
A sewing supply company has a database of tens of thousands of products that they sell in their stores.One of the variables in the database,Thread_Colour,contains the names of the colors of the various spools of thread that are sold.The most commonly sold are white,black,and brown,but there are also magenta,azure,sea foam green,and nutmeg,to name a few others.In all there are more that 500 different colours,each with a corresponding numeric code.Here are a few of them:
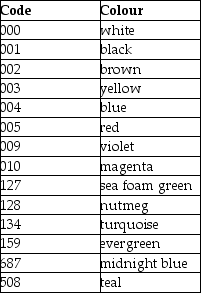 An intern who was asked to analyze the company's thread sales presented these summary statistics for the variable Thread_Colour:
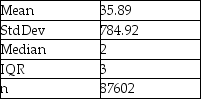 a)What does the mean of 35.89 mean?
b)What are the typical reasons that cause measures of centre and spread to be as different as those in this table?
c)Is that why these are so different?
a)What does the mean of 35.89 mean?
b)What are the typical reasons that cause measures of centre and spread to be as different as those in this table?
c)Is that why these are so different?
(Essay)
4.8/5 (34)
A business owner recorded her annual profits for the first 12 years since opening her business.The stem-and-leaf display below shows the annual profits in thousands of dollars. 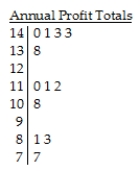 Key:
13 | 8 = $138,000 profit
Key:
13 | 8 = $138,000 profit
(Multiple Choice)
4.8/5 (36)
A student at a local university took a total of 20 exams during freshman year.The student recorded the exam scores as percentages and created the following stem-and-leaf display.The lower stem contains leaves with the digits 0-4 and the upper stem contains leaves with digits 5-9.In addition to describing the distribution,give a reason to account for the shape of this distribution. 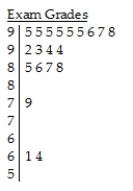 Key:
9 | 3 = 93%
Key:
9 | 3 = 93%
(Multiple Choice)
4.8/5 (34)
Ontario wanted to find the typical size of farms in the province.The data below shows the sizes (in acres)of the 84 farms located in Ontario.Create a histogram of the data using bins that are 50 acres wide. 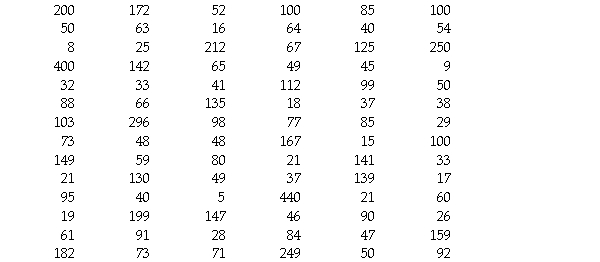
(Essay)
4.8/5 (30)
The number of days off that 30 police officers took in a given year are provided below.Create a histogram of the data using bins 2 days wide. 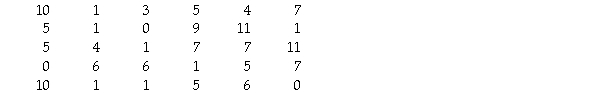
(Essay)
4.9/5 (35)
Ages of patients who had their tonsils removed at a hospital over the course of a year.
(Multiple Choice)
4.8/5 (27)
Three statistics classes (50 students each)took the same test.Shown below are histograms of the scores for the classes.Use the histograms to answer the question. 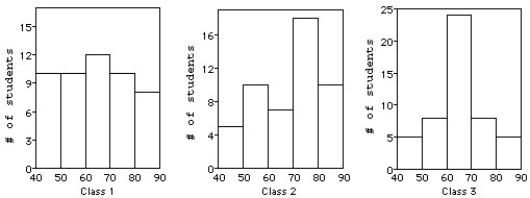 -Which class had the smallest IQR?
(Multiple Choice)
4.8/5 (39)
A new business had the following monthly revenues,in dollars. 
(Multiple Choice)
4.8/5 (32)
Here is the stem-and-leaf display of the midterm test scores for the seventh-period typing class. 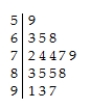 Would you use the median or the mean to describe the centre of this distribution?
(Multiple Choice)
4.8/5 (40)
Filters
- Essay(0)
- Multiple Choice(0)
- Short Answer(0)
- True False(0)
- Matching(0)