Exam 31: Rank-Based Nonparametric Tests
Exam 1: Data30 Questions
Exam 2: Displaying and Describing Categorical Data65 Questions
Exam 3: Displaying and Summarizing Quantitative Data93 Questions
Exam 4: Understanding and Comparing Distributions102 Questions
Exam 5: The Standard Deviation As a Ruler and the Normal Model131 Questions
Exam 6: Scatterplots, association, and Correlation74 Questions
Exam 7: Linear Regression57 Questions
Exam 8: Regression Wisdom32 Questions
Exam 9: Re-Expressing Data: Get It Straight51 Questions
Exam 10: Understanding Randomness26 Questions
Exam 11: Sample Surveys50 Questions
Exam 12: Experiments and Observational Surveys87 Questions
Exam 13: From Randomness to Probability64 Questions
Exam 14: Probability Rules90 Questions
Exam 15: Random Variables112 Questions
Exam 16: Probability Models114 Questions
Exam 17: Sampling Distribution Models45 Questions
Exam 18: Confidence Intervals for Proportions56 Questions
Exam 19: Testing Hypotheses About Proportions50 Questions
Exam 20: More About Tests69 Questions
Exam 21: Comparing Two Proportions52 Questions
Exam 22: Inferences About Means106 Questions
Exam 23: Comparing Means43 Questions
Exam 24: Paired Samples and Blocks33 Questions
Exam 25: Comparing Counts78 Questions
Exam 26: Inferences for Regression51 Questions
Exam 27: Analysis of Variance39 Questions
Exam 28: Multifactor Analysis of Variance22 Questions
Exam 29: Multiple Regression22 Questions
Exam 30: Multiple Regression Wisdom21 Questions
Exam 31: Rank-Based Nonparametric Tests29 Questions
Exam 32: The Bootstrap31 Questions
Select questions type
The paired data below consist of the test scores of 6 randomly selected students and the number of hours they studied for the test. 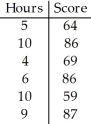 Compute Spearman's rank correlation.Assume that rank ties will have little influence on your result.
Free
(Multiple Choice)
5.0/5  (24)
(24)
Correct Answer: Verified
C
Below are bacteria count for three different hand-washing methods;alcohol spray,antibacterial soap,and regular soap.Conduct a Kruskal-Wallis test to determine if there are differences between the three methods in terms of their bacteria count.Use a 0.05 level of significance. 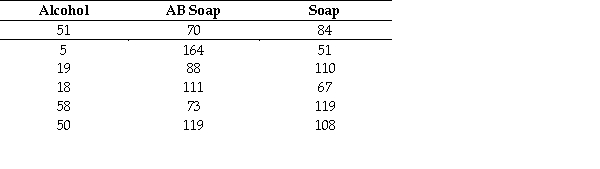
Free
(Essay)
4.9/5 (36)
Correct Answer:Verified
H0: The distributions of bacteria count are identical for all four methods.HA: At least two of the distributions differ from one another.
T1= 22.5,T2 = 80.5,T3 = 68
Test statistic: H = 10.9,P-value = 0.0043
Reject the null hypothesis.There is sufficient evidence to suggest at least two of the hand-washing methods differ in terms of their distribution of bacteria count.
The table below displays data showing weight gain,in grams,for nine young rats,three from each of three litters.Three different diets (the treatments)were assigned at random to the three siblings in litter one (block 1).This was repeated for the other two litters (blocks 2 and 3). 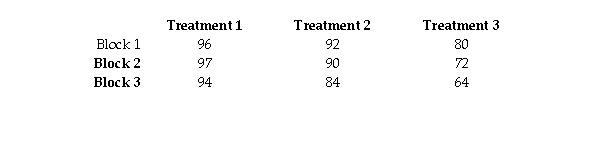 Conduct a Friedman test at the 0.05 level of significance to determine if there are differences between the three diets.
Free
(Essay)
4.7/5 (39)
Correct Answer:Verified
H0: The distributions of weight gain are identical for all three diets.
HA: At least two of the distributions differ from one another.
T1= 9,T2 = 6,T3 = 3
Test statistic: S = 6.00,P-value = 0.0498
Reject the null hypothesis.There is sufficient evidence to suggest at least two of diets differ in terms of their distribution of weight gain.
SAT scores for students selected randomly from two different schools are shown in the table.At a significance level of 0.05,does the Wilcoxon rank sum test provide evidence of a difference between the two schools? 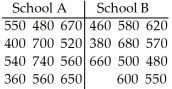
(Essay)
4.7/5 (26)
A coach uses a new technique in training middle distance runners.The times for 8 different athletes to run 800 metres before and after this training are shown below. 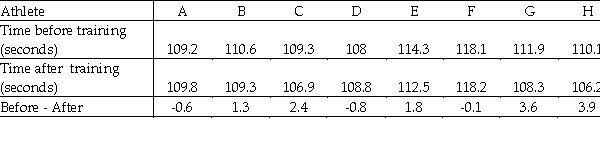 Do the data suggest that the training helps to improve the athletes' times for the 800 metres? Perform a Wilcoxon signed-rank test at the 5% significance level.
(Essay)
5.0/5 (41)
Below are bacteria count for four different hand-washing methods;alcohol spray,antibacterial soap,regular soap,and water alone.Conduct a Kruskal-Wallis test to determine if there are differences between the four methods in terms of their bacteria count.Use a 0.05 level of significance. 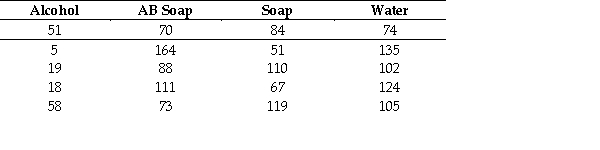
(Essay)
5.0/5 (32)
Consider the following data from an experiment using a randomized block design. 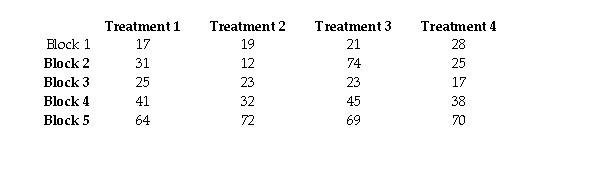 Conduct a Friedman test at the 0.05 level of significance to determine if there are differences between the four treatments.
(Essay)
4.9/5 (30)
The table below shows the weights of seven subjects before and after following a particular diet for two months. 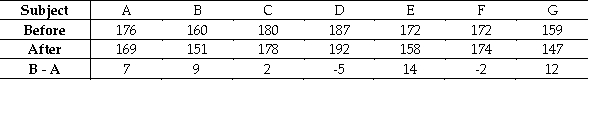 Do the data suggest that the diet is effective in reducing weight? Perform a Wilcoxon signed rank test at the 5% significance level.
(Essay)
5.0/5 (38)
A person who commutes to work is choosing between two different routes.He drives the first route 11 times and the second route 12 times and records the travel time of each trip.The results (in minutes)are shown in the table.Use a significance level of 0.01,does the Wilcoxon rank sum test provide evidence of a difference between the two routes? 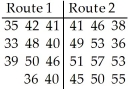
(Essay)
4.8/5 (45)
A group of persons filled in a questionnaire their age and the number of countries they had visited in their lifetime.The results are recorded in the table below. 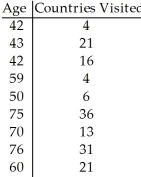 Compute Spearman's rank correlation.Assume that rank ties will have little influence on your result.
(Multiple Choice)
4.9/5 (36)
The table below displays data showing weight gain,in grams,for 12 young rats,three from each of four litters.Three different diets (the treatments)were assigned at random to the three siblings in litter one (block 1).This was repeated for the other three litters (blocks 2,3,and 4). 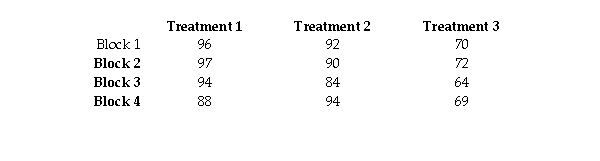 Conduct a Friedman test at the 0.05 level of significance to determine if there are differences between the three diets.
(Essay)
4.7/5 (34)
A researcher wishes to compare the GPAs at the Scarborough and Mississauga campuses at the University of Toronto are different.The sample data are listed below.At a 0.05 level of significance,does the Wilcoxon rank sum test provide evidence of a difference between the two campuses? 
(Essay)
4.9/5 (37)
A researcher was interested in comparing the GPAs of students at the three University of Toronto campuses: Scarborough,Mississauga,and St.George.Independent random samples of students were taken from each campus and their GPAs were recorded.At a significance level of 0.10,does the Kruskal-Wallis test provide evidence of any differences between the campuses in terms of the GPAs? 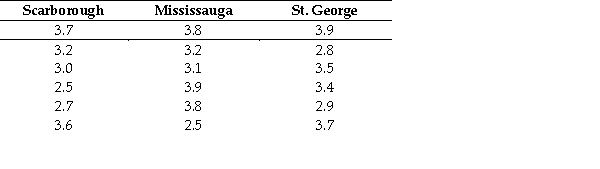
(Essay)
4.8/5 (39)
Five students took a math test before and after tutoring.Their scores were as follows. 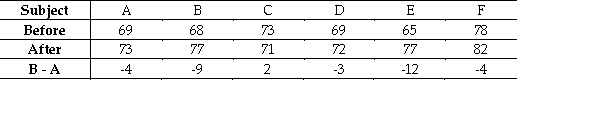 Do the data suggest that the tutoring improves math scores? Conduct a Wilcoxon signed rank test using a 0.05 level of significance.
(Essay)
4.9/5 (29)
A teacher uses two different programs to remediate students.Results for each group on a standardized test are listed in the table.At the 0.05 level of significance,does the Wilcoxon rank sum test provide evidence of a difference between the two programs in terms of the scores that students obtain? 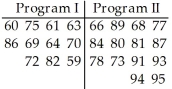
(Essay)
4.8/5 (40)
A study was conducted to compare the average time spent in the lab each week versus course grade for computer students.The results are recorded in the table below. 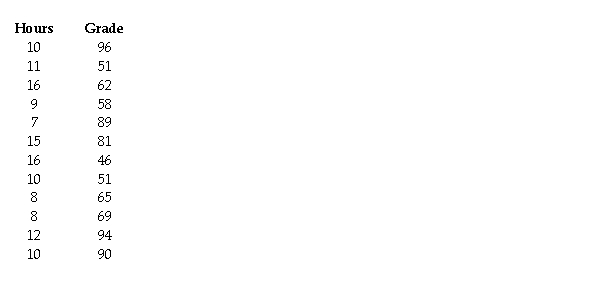 Using a 5% level of significance,perform a nonparametric test to determine if there is a monotonic association between the number of hours spent in the lab each week and the grade a student receives.Assume that rank ties will have little influence on your result.
(Essay)
4.9/5 (27)
Two different tests are designed to measure employee productivity and dexterity.Several employees are randomly selected and tested with these results. 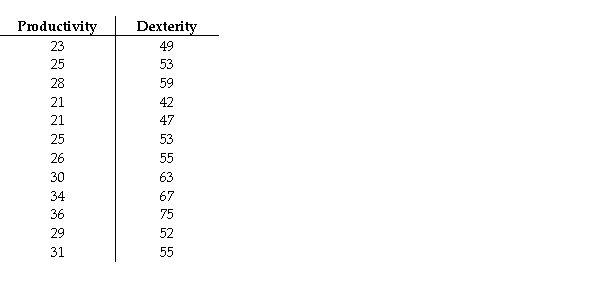 Using a 5% level of significance,perform a nonparametric test to determine if there is a monotonic association between an employee's productivity and their dexterity.Assume that rank ties will have little influence on your result.
(Essay)
4.8/5 (36)
Ten different families are tested for the number of litres of water a week they use before and after viewing a conservation video.Do the data suggest that the amount after the viewing differs from the amount before the viewing? Perform a Wilcoxon signed rank test at the 5% significance level. 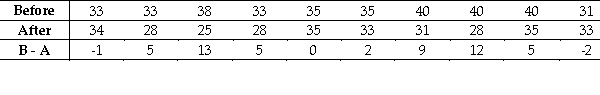
(Essay)
4.9/5 (32)
Two different tests are designed to measure employee productivity and dexterity.Several employees are randomly selected and tested with these results. 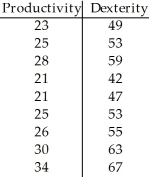 36 75
Compute Spearman's rank correlation.Assume that rank ties will have little influence on your result.
36 75
Compute Spearman's rank correlation.Assume that rank ties will have little influence on your result.
(Multiple Choice)
4.9/5 (37)
A soft drink company is introducing a new drink and wishes to evaluate which of three different formulas will be most popular.Five people taste each of the three formulas in a random order and rate each formula's taste on a scale from 1 to 10.The results are given below. 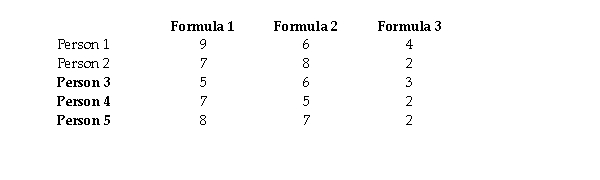 Conduct a Friedman test at the 0.05 level of significance to determine if there are differences in consumer ratings between the three formulas.
(Essay)
4.9/5 (42)
Filters
- Essay(0)
- Multiple Choice(0)
- Short Answer(0)
- True False(0)
- Matching(0)