Exam 4: Section 6: Applications of Differentiation
Exam 1: Section 1: Preparation for Calculus16 Questions
Exam 1: Section 2: Preparation for Calculus26 Questions
Exam 1: Section 3: Preparation for Calculus23 Questions
Exam 1: Section 4: Preparation for Calculus16 Questions
Exam 1: Section 5: Preparation for Calculus25 Questions
Exam 1: Section 6: Preparation for Calculus8 Questions
Exam 2: Section 1: Limits and Their Properties10 Questions
Exam 2: Section 2: Limits and Their Properties14 Questions
Exam 2: Section 3: Limits and Their Properties25 Questions
Exam 2: Section 4: Limits and Their Properties20 Questions
Exam 2: Section 5 : Limits and Their Properties18 Questions
Exam 3: Section 1 : Differentiation20 Questions
Exam 3: Section 2: Differentiation25 Questions
Exam 3: Section 3: Differentiation26 Questions
Exam 3: Section 4 : Differentiation44 Questions
Exam 3: Section 5: Differentiation30 Questions
Exam 3: Section 6: Differentiation16 Questions
Exam 3: Section 7: Differentiation16 Questions
Exam 3: Section 8: Differentiation12 Questions
Exam 4: Section 1 : Applications of Differentiation19 Questions
Exam 4: Section 2: Applications of Differentiation17 Questions
Exam 4: Section 3: Applications of Differentiation17 Questions
Exam 4: Section 4: Applications of Differentiation26 Questions
Exam 4: Section 5: Applications of Differentiation23 Questions
Exam 4: Section 6: Applications of Differentiation22 Questions
Exam 4: Section 7: Applications of Differentiation15 Questions
Exam 4: Section 8: Applications of Differentiation16 Questions
Exam 4: Section 1: Integration19 Questions
Exam 4: Section 2: Integration17 Questions
Exam 4: Section 3: Integration19 Questions
Exam 4: Section 4: Integration18 Questions
Exam 4: Section 5: Integration31 Questions
Exam 4: Section 6: Integration18 Questions
Exam 4: Section 7: Integration27 Questions
Exam 4: Section 8: Integration16 Questions
Exam 4: Section 9: Integration20 Questions
Exam 6: Section 1: Differential Equations19 Questions
Exam 6: Section 2: Differential Equations25 Questions
Exam 6: Section 3: Differential Equations12 Questions
Exam 6: Section 4: Differential Equations14 Questions
Exam 6: Section 5: Differential Equations17 Questions
Exam 7: Section 1: Applications of Integration18 Questions
Exam 7: Section 2: Applications of Integration18 Questions
Exam 7: Section 3: Applications of Integration17 Questions
Exam 7: Section 4: Applications of Integration18 Questions
Exam 7: Section 5: Applications of Integration16 Questions
Exam 7: Section 6: Applications of Integration19 Questions
Exam 7: Section 7: Applications of Integration15 Questions
Exam 8: Section 1: Integration Techniques, Lhôpitals Rule, and Improper Integrals15 Questions
Exam 8: Section 2: Integration Techniques, Lhôpitals Rule, and Improper Integrals18 Questions
Exam 8: Section 3: Integration Techniques, Lhôpitals Rule, and Improper Integrals20 Questions
Exam 8: Section 4: Integration Techniques, Lhôpitals Rule, and Improper Integrals19 Questions
Exam 8: Section 5: Integration Techniques, Lhôpitals Rule, and Improper Integrals14 Questions
Exam 8: Section 6: Integration Techniques, Lhôpitals Rule, and Improper Integrals15 Questions
Exam 8: Section 7: Integration Techniques, Lhôpitals Rule, and Improper Integrals18 Questions
Exam 8: Section 8: Integration Techniques, Lhôpitals Rule, and Improper Integrals15 Questions
Exam 9: Section 1: Infinite Series17 Questions
Exam 9: Section 2: Infinite Series23 Questions
Exam 9: Section 3: Infinite Series18 Questions
Exam 9: Section 4: Infinite Series21 Questions
Exam 9: Section 5: Infinite Series15 Questions
Exam 9: Section 6: Infinite Series21 Questions
Exam 9: Section 7: Infinite Series18 Questions
Exam 9: Section 8: Infinite Series18 Questions
Exam 9: Section 9: Infinite Series19 Questions
Exam 9: Section 10: Infinite Series16 Questions
Exam 10: Section 1: Conics, Parametric Equations, and Polar Coordinates26 Questions
Exam 10: Section 2: Conics, Parametric Equations, and Polar Coordinates17 Questions
Exam 10: Section 3: Conics, Parametric Equations, and Polar Coordinates22 Questions
Exam 10: Section 4: Conics, Parametric Equations, and Polar Coordinates15 Questions
Exam 10: Section 5: Conics, Parametric Equations, and Polar Coordinates18 Questions
Exam 10: Section 6: Conics, Parametric Equations, and Polar Coordinates19 Questions
Exam 11: Section 1: Vectors and the Geometry of Space20 Questions
Exam 11: Section 2: Vectors and the Geometry of Space21 Questions
Exam 11: Section 3: Vectors and the Geometry of Space18 Questions
Exam 11: Section 4: Vectors and the Geometry of Space18 Questions
Exam 11: Section 5: Vectors and the Geometry of Space21 Questions
Exam 11: Section 6: Vectors and the Geometry of Space20 Questions
Exam 11: Section 7: Vectors and the Geometry of Space19 Questions
Exam 12: Section 1: Vector-Valued Functions21 Questions
Exam 12: Section 2: Vector-Valued Functions24 Questions
Exam 12: Section 3: Vector-Valued Functions18 Questions
Exam 12: Section 4: Vector-Valued Functions20 Questions
Exam 12: Section 5: Vector-Valued Functions19 Questions
Exam 13: Section 1: Functions of Several Variables19 Questions
Exam 13: Section 2: Functions of Several Variables22 Questions
Exam 13: Section 3: Functions of Several Variables23 Questions
Exam 13: Section 4: Functions of Several Variables17 Questions
Exam 13: Section 6: Functions of Several Variables20 Questions
Exam 13: Section 7: Functions of Several Variables20 Questions
Exam 13: Section 8: Functions of Several Variables20 Questions
Exam 13: Section 9: Functions of Several Variables17 Questions
Exam 13: Section 10: Functions of Several Variables18 Questions
Exam 14: Section 1: Multiple Integration20 Questions
Exam 14: Section 2: Multiple Integration19 Questions
Exam 14: Section 3: Multiple Integration20 Questions
Exam 14: Section 4: Multiple Integration18 Questions
Exam 14: Section 5: Multiple Integration18 Questions
Exam 14: Section 6: Multiple Integration19 Questions
Exam 14: Section 7: Multiple Integration19 Questions
Exam 14: Section 8: Multiple Integration19 Questions
Exam 15: Section 1: Vector Analysis21 Questions
Exam 15: Section 2: Vector Analysis18 Questions
Exam 15: Section 3: Vector Analysis18 Questions
Exam 15: Section 4: Vector Analysis18 Questions
Exam 15: Section 5: Vector Analysis21 Questions
Exam 15: Section 6: Vector Analysis18 Questions
Exam 15: Section 7: Vector Analysis18 Questions
Exam 15: Section 8: Vector Analysis17 Questions
Select questions type
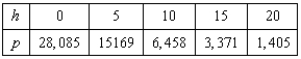
A meteorologist measures the atmospheric pressure P (in kilograms per square meter) at altitude h (in kilometers). The data are shown below. Find the rate of change of the pressure with respect to altitude when  using the relation
  . Round your answer to one decimal place.
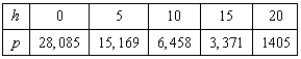
Free
(Multiple Choice)
4.9/5  (31)
(31)
Correct Answer: Verified
B
Analyze and sketch a graph of the function 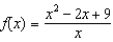 .
.
Free
(Multiple Choice)
4.7/5 (40)
Correct Answer:Verified
E
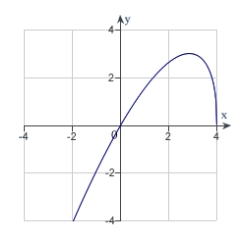
The graph of f is shown below. On what interval is  an increasing function?
Free
(Multiple Choice)
4.9/5 (33)
Correct Answer:Verified
E
The graph of a function f is is shown below. Sketch the graph of the derivative  .
. 
(Multiple Choice)
4.9/5 (37)
The graph of a function f is is shown below. Sketch the graph of the derivative  .
. 
(Multiple Choice)
4.8/5 (31)
A valve on a storage tank is opened for 4 hours to release a chemical in a manufacturing process. The flow rate R (in liters per hour) at time t (in hours) is given by the linear model  Write the linear model in exponential form.
(Multiple Choice)
4.8/5 (36)
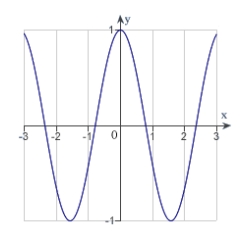
The graph of f is shown below. For which value of x is  zero?
zero? 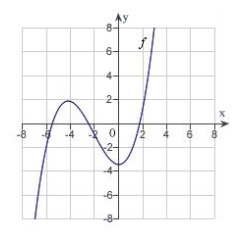
(Multiple Choice)
4.8/5 (29)
The graph of f is shown below. For which values of x is  zero?
zero? 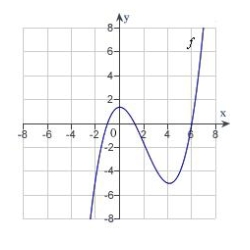
(Multiple Choice)
5.0/5 (37)
A meteorologist measures the atmospheric pressure P (in kilograms per square meter) at altitude h (in kilometers). The data are shown below. Use the regression capabilities of the graphing utility to find a linear model for the revised data points obtained by plotting the points 
(Multiple Choice)
4.9/5 (33)
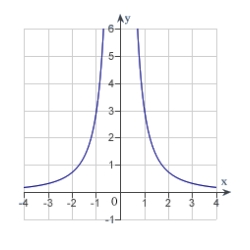
Analyze the graph of the function 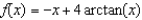 . Determine any intercepts, relative extrema, points of inflection and asymptotes. Also determine where the graph is increasing or decreasing and concave up or concave down. Then identify the graph from the choices below.
(Multiple Choice)
4.7/5 (29)
The graph of a function f is is shown below. Sketch the graph of the derivative  .
. 
(Multiple Choice)
4.9/5 (38)
Filters
- Essay(0)
- Multiple Choice(0)
- Short Answer(0)
- True False(0)
- Matching(0)