Exam 1: Section 4: Preparation for Calculus
Exam 1: Section 1: Preparation for Calculus16 Questions
Exam 1: Section 2: Preparation for Calculus26 Questions
Exam 1: Section 3: Preparation for Calculus23 Questions
Exam 1: Section 4: Preparation for Calculus16 Questions
Exam 1: Section 5: Preparation for Calculus25 Questions
Exam 1: Section 6: Preparation for Calculus8 Questions
Exam 2: Section 1: Limits and Their Properties10 Questions
Exam 2: Section 2: Limits and Their Properties14 Questions
Exam 2: Section 3: Limits and Their Properties25 Questions
Exam 2: Section 4: Limits and Their Properties20 Questions
Exam 2: Section 5 : Limits and Their Properties18 Questions
Exam 3: Section 1 : Differentiation20 Questions
Exam 3: Section 2: Differentiation25 Questions
Exam 3: Section 3: Differentiation26 Questions
Exam 3: Section 4 : Differentiation44 Questions
Exam 3: Section 5: Differentiation30 Questions
Exam 3: Section 6: Differentiation16 Questions
Exam 3: Section 7: Differentiation16 Questions
Exam 3: Section 8: Differentiation12 Questions
Exam 4: Section 1 : Applications of Differentiation19 Questions
Exam 4: Section 2: Applications of Differentiation17 Questions
Exam 4: Section 3: Applications of Differentiation17 Questions
Exam 4: Section 4: Applications of Differentiation26 Questions
Exam 4: Section 5: Applications of Differentiation23 Questions
Exam 4: Section 6: Applications of Differentiation22 Questions
Exam 4: Section 7: Applications of Differentiation15 Questions
Exam 4: Section 8: Applications of Differentiation16 Questions
Exam 4: Section 1: Integration19 Questions
Exam 4: Section 2: Integration17 Questions
Exam 4: Section 3: Integration19 Questions
Exam 4: Section 4: Integration18 Questions
Exam 4: Section 5: Integration31 Questions
Exam 4: Section 6: Integration18 Questions
Exam 4: Section 7: Integration27 Questions
Exam 4: Section 8: Integration16 Questions
Exam 4: Section 9: Integration20 Questions
Exam 6: Section 1: Differential Equations19 Questions
Exam 6: Section 2: Differential Equations25 Questions
Exam 6: Section 3: Differential Equations12 Questions
Exam 6: Section 4: Differential Equations14 Questions
Exam 6: Section 5: Differential Equations17 Questions
Exam 7: Section 1: Applications of Integration18 Questions
Exam 7: Section 2: Applications of Integration18 Questions
Exam 7: Section 3: Applications of Integration17 Questions
Exam 7: Section 4: Applications of Integration18 Questions
Exam 7: Section 5: Applications of Integration16 Questions
Exam 7: Section 6: Applications of Integration19 Questions
Exam 7: Section 7: Applications of Integration15 Questions
Exam 8: Section 1: Integration Techniques, Lhôpitals Rule, and Improper Integrals15 Questions
Exam 8: Section 2: Integration Techniques, Lhôpitals Rule, and Improper Integrals18 Questions
Exam 8: Section 3: Integration Techniques, Lhôpitals Rule, and Improper Integrals20 Questions
Exam 8: Section 4: Integration Techniques, Lhôpitals Rule, and Improper Integrals19 Questions
Exam 8: Section 5: Integration Techniques, Lhôpitals Rule, and Improper Integrals14 Questions
Exam 8: Section 6: Integration Techniques, Lhôpitals Rule, and Improper Integrals15 Questions
Exam 8: Section 7: Integration Techniques, Lhôpitals Rule, and Improper Integrals18 Questions
Exam 8: Section 8: Integration Techniques, Lhôpitals Rule, and Improper Integrals15 Questions
Exam 9: Section 1: Infinite Series17 Questions
Exam 9: Section 2: Infinite Series23 Questions
Exam 9: Section 3: Infinite Series18 Questions
Exam 9: Section 4: Infinite Series21 Questions
Exam 9: Section 5: Infinite Series15 Questions
Exam 9: Section 6: Infinite Series21 Questions
Exam 9: Section 7: Infinite Series18 Questions
Exam 9: Section 8: Infinite Series18 Questions
Exam 9: Section 9: Infinite Series19 Questions
Exam 9: Section 10: Infinite Series16 Questions
Exam 10: Section 1: Conics, Parametric Equations, and Polar Coordinates26 Questions
Exam 10: Section 2: Conics, Parametric Equations, and Polar Coordinates17 Questions
Exam 10: Section 3: Conics, Parametric Equations, and Polar Coordinates22 Questions
Exam 10: Section 4: Conics, Parametric Equations, and Polar Coordinates15 Questions
Exam 10: Section 5: Conics, Parametric Equations, and Polar Coordinates18 Questions
Exam 10: Section 6: Conics, Parametric Equations, and Polar Coordinates19 Questions
Exam 11: Section 1: Vectors and the Geometry of Space20 Questions
Exam 11: Section 2: Vectors and the Geometry of Space21 Questions
Exam 11: Section 3: Vectors and the Geometry of Space18 Questions
Exam 11: Section 4: Vectors and the Geometry of Space18 Questions
Exam 11: Section 5: Vectors and the Geometry of Space21 Questions
Exam 11: Section 6: Vectors and the Geometry of Space20 Questions
Exam 11: Section 7: Vectors and the Geometry of Space19 Questions
Exam 12: Section 1: Vector-Valued Functions21 Questions
Exam 12: Section 2: Vector-Valued Functions24 Questions
Exam 12: Section 3: Vector-Valued Functions18 Questions
Exam 12: Section 4: Vector-Valued Functions20 Questions
Exam 12: Section 5: Vector-Valued Functions19 Questions
Exam 13: Section 1: Functions of Several Variables19 Questions
Exam 13: Section 2: Functions of Several Variables22 Questions
Exam 13: Section 3: Functions of Several Variables23 Questions
Exam 13: Section 4: Functions of Several Variables17 Questions
Exam 13: Section 6: Functions of Several Variables20 Questions
Exam 13: Section 7: Functions of Several Variables20 Questions
Exam 13: Section 8: Functions of Several Variables20 Questions
Exam 13: Section 9: Functions of Several Variables17 Questions
Exam 13: Section 10: Functions of Several Variables18 Questions
Exam 14: Section 1: Multiple Integration20 Questions
Exam 14: Section 2: Multiple Integration19 Questions
Exam 14: Section 3: Multiple Integration20 Questions
Exam 14: Section 4: Multiple Integration18 Questions
Exam 14: Section 5: Multiple Integration18 Questions
Exam 14: Section 6: Multiple Integration19 Questions
Exam 14: Section 7: Multiple Integration19 Questions
Exam 14: Section 8: Multiple Integration19 Questions
Exam 15: Section 1: Vector Analysis21 Questions
Exam 15: Section 2: Vector Analysis18 Questions
Exam 15: Section 3: Vector Analysis18 Questions
Exam 15: Section 4: Vector Analysis18 Questions
Exam 15: Section 5: Vector Analysis21 Questions
Exam 15: Section 6: Vector Analysis18 Questions
Exam 15: Section 7: Vector Analysis18 Questions
Exam 15: Section 8: Vector Analysis17 Questions
Select questions type
Students in a lab measured the breaking strength S (in pounds) of wood 2 inches thick, x inches high, and 12 inches long. The results are shown in the table below. Use the regression capabilities of a graphing utility to fit a quadratic model to the data. Round the numerical values in your answer to two decimal places, where applicable. 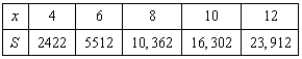
Free
(Multiple Choice)
4.8/5  (37)
(37)
Correct Answer: Verified
B
The following ordered pairs represent temperatures in degrees Fahrenheit taken each hour from 1:00 pm until 5:00 pm. Let T be temperature, and let t be time, where  corresponds to 1:00 pm,
  corresponds to 2:00 pm, and so on. Plot the data. Visually find a linear model for the data and find its equation. From the visual linear model that you created, determine which of the models that follow appears to best approximate the data. (1:00 pm ,
  ), (2:00 pm ,
  ), (3:00 pm ,
  ), (4:00 pm ,
  ), (5:00 pm ,
  )
)
Free
(Multiple Choice)
4.9/5 (27)
Correct Answer:Verified
E
Hooke's Law states that the force F required to compress or stretch a spring (within its elastic limits) is proportional to the distance d that the spring is compressed or stretched from its original length. That is,  where k is a measure of the stiffness of the spring and is called the spring constant. The table shows the elongation d in centimeters of a spring when a force of F newtons is applied. Use a graphing utility to plot the data and graph the linear model.
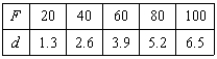
Free
(Multiple Choice)
4.8/5 (33)
Correct Answer:Verified
D
A V8 car engine is coupled to a dynamometer and the horsepower y is measured at different engine speeds x (in thousands of revolutions per minute). The results are shown in the table below. Use the regression capabilities of a graphing utility to find a cubic model for the data. Round the numerical values in your answer to three decimal places, where applicable. 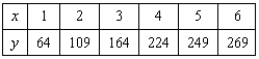
(Multiple Choice)
5.0/5 (37)
Each ordered pair gives the exposure index x of a carcinogenic substance and the cancer mortality y per 100,000 people in the population. Use the model  to approximate y if
  . Round your answer to one decimal place.
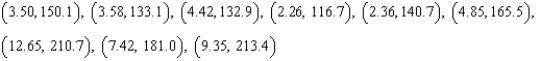
(Multiple Choice)
4.8/5 (38)
Which function below would be most appropriate model for the given data? 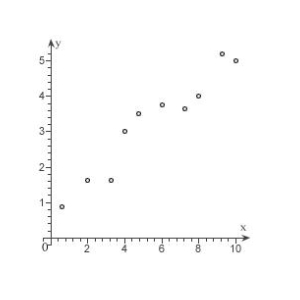
(Multiple Choice)
4.8/5 (37)
Students in a lab measured the breaking strength S (in pounds) of wood 2 inches thick, x inches high, and 12 inches long. The results are shown in the table below. Use a graphing utility to plot the data and graph the quadratic model. 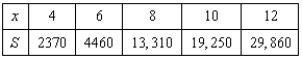
(Multiple Choice)
4.9/5 (40)
In an experiment, students measured the speed s (in meters per second) of a falling object t seconds after it was released. The results are shown in the table below. Use the regression capabilities of a graphing utility to find a linear model for the data. Round all numerical values in your answer to one decimal place. 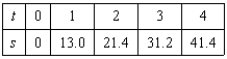
(Multiple Choice)
4.8/5 (32)
A V8 car engine is coupled to a dynamometer and the horsepower y is measured at different engine speeds x (in thousands of revolutions per minute). The results are shown in the table below. Use the model 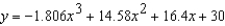 to approximate the horsepower when the engine is running at 5500 revolutions per minute. Round your answer to two decimal places.
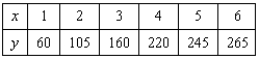
(Multiple Choice)
4.7/5 (37)
Students in a lab measured the breaking strength S (in pounds) of wood 2 inches thick, x inches high, and 12 inches long. The results are shown in the table below. Use the model 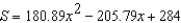 to approximate the breaking strength when
  . Round your answer to two decimal places.
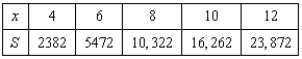
(Multiple Choice)
4.9/5 (38)
Determine which type of function would be most appropriate to fit the given data. 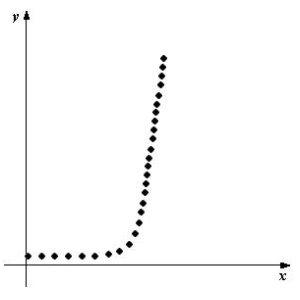
(Multiple Choice)
4.8/5 (36)
In an experiment, students measured the speed s (in meters per second) of a falling object t seconds after it was released. The results are shown in the table below. Use the model  to estimate the speed of the object after
  seconds. Round your answer to two decimal places.
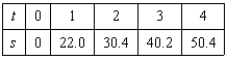
(Multiple Choice)
4.7/5 (31)
Hooke's Law states that the force F required to compress or stretch a spring (within its elastic limits) is proportional to the distance d that the spring is compressed or stretched from its original length. That is,  where k is a measure of the stiffness of the spring and is called the spring constant. The table shows the elongation d in centimeters of a spring when a force of F newtons is applied. Use the regression capabilities of a graphing utility to find a linear model for the data. Round the numerical values in your answer to three decimal places.
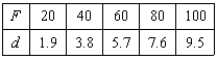
(Multiple Choice)
4.8/5 (29)
A V8 car engine is coupled to a dynamometer and the horsepower y is measured at different engine speeds x (in thousands of revolutions per minute). The results are shown in the table below. Use a graphing utility to plot the data and graph the cubic model. 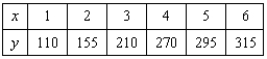
(Multiple Choice)
4.9/5 (28)
In an experiment, students measured the speed s (in meters per second) of a falling object t seconds after it was released. The results are shown in the table below. Use the regression capabilities of a graphing utility to find a linear model for the data. Round all numerical values in your answer to one decimal place. 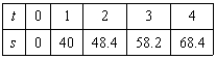
(Multiple Choice)
4.8/5 (44)
Hooke's Law states that the force F required to compress or stretch a spring (within its elastic limits) is proportional to the distance d that the spring is compressed or stretched from its original length. That is,  where k is a measure of the stiffness of the spring and is called the spring constant. The table shows the elongation d in centimeters of a spring when a force of F newtons is applied. Use the model
  to estimate the elongation of the spring when a force of 55 newtons is applied. Round your answer to two decimal places.
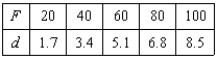
(Multiple Choice)
4.8/5 (28)
Filters
- Essay(0)
- Multiple Choice(0)
- Short Answer(0)
- True False(0)
- Matching(0)