Exam 16: Simple Linear Regression and Correlation
Exam 1: What Is Statistics39 Questions
Exam 2: Graphical and Tabular Descriptive Techniques192 Questions
Exam 3: Numerical Descriptive Techniques215 Questions
Exam 4: Data Collection and Sampling82 Questions
Exam 5: Probability200 Questions
Exam 6: Random Variables and Discrete Probability Distributions158 Questions
Exam 7: Continuous Probability Distributions149 Questions
Exam 8: Sampling Distributions127 Questions
Exam 9: Introduction to Estimation85 Questions
Exam 10: Introduction to Hypothesis Testing178 Questions
Exam 11: Inference About a Population75 Questions
Exam 12: Inference About Comparing Two Populations, Part 183 Questions
Exam 13: Inference About Comparing Two Populations, Part 284 Questions
Exam 14: Analysis of Variance125 Questions
Exam 15: Chi-Squared Tests118 Questions
Exam 16: Simple Linear Regression and Correlation231 Questions
Exam 17: Multiple Regression143 Questions
Exam 18: Review of Statistical Inference182 Questions
Select questions type
In testing the hypotheses: H0: 1 = 0 vs. H0: 1 0, the following statistics are available:  ,
,  ,
,  ,
,  , and
, and  . The value of the test statistic is:
(Multiple Choice)
4.9/5  (24)
(24)
The width of the confidence interval estimate for the predicted value of y depends on
(Multiple Choice)
4.8/5 (40)
If there is no linear relationship between two variables x and y, the coefficient of determination must be -1.0.
(True/False)
4.8/5 (30)
Rock Concert Revenues: A financier whose specialty is investing in rock concerts has observed that, in general, concerts with "big-name" stars seem to generate more revenue than those concerts whose stars are less well known. To examine his belief he records the gross revenue and the payment (in $ millions) given to the two highest-paid performers in the concert for ten concert tours.
 -Determine the coefficient of determination and discuss what its value tells you about the two variables.
(Essay)
4.8/5 (25)
If the regression line is horizontal, the slope is ____________________ and x and y are not related.
(Short Answer)
4.8/5 (25)
In order to estimate with 95% confidence the expected value of y for a given value of x in a simple linear regression problem, a random sample of 10 observations is taken. Which of the following t-table values listed below would be used?
(Multiple Choice)
4.7/5 (36)
A regression analysis between sales (in $) and advertising (in $) resulted in the following least squares line:  . This implies that an increase of $1 in advertising is associated with an increase of $60 in sales.
(True/False)
4.8/5 (35)
Cost of Textbooks: The editor of a higher education book publisher claims that a large part of the cost of books is the cost of paper. This implies that larger textbooks will cost more money. As an experiment to analyze the claim, a university student visits the bookstore and records the number of pages and the selling price of twelve randomly selected textbooks. These data are listed below.
 -Determine the least squares regression line.
(Essay)
4.8/5 (32)
The residual ri is defined as the difference between the actual value yi and the estimated value  .
.
(True/False)
5.0/5 (28)
Car Speed and Gas Mileage: An economist wanted to analyze the relationship between the speed of a car (x) and its gas mileage (y). As an experiment a car is operated at several different speeds and for each speed the gas mileage is measured. These data are shown below.
 -Calculate the coefficient of determination and interpret its value.
(Essay)
4.9/5 (34)
If the regression line is horizontal, then we conclude that y ____________________ (is/is not) related to x.
(Short Answer)
4.8/5 (37)
Conduct a test of the population coefficient of correlation to determine at the 5% significance level whether a positive linear relationship exists between the quality of oil and price per barrel.
(Essay)
4.9/5 (31)
SSE stands for ____________________ of squares for ____________________.
(Short Answer)
4.8/5 (32)
If all the points in a scatter diagram lie on the least squares regression line, then the coefficient of correlation must be 1.0.
(True/False)
4.8/5 (33)
Oil Quality and Price: Quality of oil is measured in API gravity degrees--the higher the degrees API, the higher the quality. The table shown below is produced by an expert in the field who believes that there is a relationship between quality and price per barrel.
 A partial Minitab output follows:


 -Estimate with 95% confidence the average oil price per barrel for an API degree of 35.
(Essay)
4.8/5 (37)
The confidence interval estimate of the expected value of y for a given value x, compared to the prediction interval of y for the same given value of x and confidence level, will be:
(Multiple Choice)
4.9/5 (31)
Cost of Books: The editor of a major academic book publisher claims that a large part of the cost of books is the cost of paper. This implies that larger books will cost more money. As an experiment to analyze the claim, a university student visits the bookstore and records the number of pages and the selling price of twelve randomly selected books. These data are listed below.
 -Can we infer at the 5% significance level that the editor is correct?
(Essay)
4.8/5 (33)
Oil Quality and Price: Quality of oil is measured in API gravity degrees--the higher the degrees API, the higher the quality. The table shown below is produced by an expert in the field who believes that there is a relationship between quality and price per barrel.
A partial Minitab output follows:
-Determine the least squares regression line.
(Essay)
4.7/5 (36)
Theatre Revenues: A financier whose specialty is investing in stage productions has observed that, in general, movies with "big-name" stars seem to generate more revenue than those plays whose stars are less well known. To examine his belief he records the gross revenue and the payment (in $ millions) given to the two highest-paid performers in the play for ten recently staged plays.
 -Determine the least squares regression line.
(Essay)
4.8/5 (35)
Wayne Newton Concert: At a recent Wayne Newton concert, a survey was conducted that asked a random sample of 20 people their age and how many concerts they have attended since the first of the year. The following data were collected:
 An Excel output follows:
 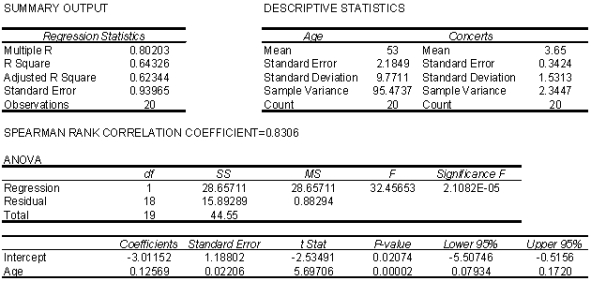 -Estimate with 95% confidence the average number of concerts attended by all 45 year-old individuals.
(Essay)
4.8/5 (38)
Filters
- Essay(0)
- Multiple Choice(0)
- Short Answer(0)
- True False(0)
- Matching(0)