Exam 16: Simple Linear Regression and Correlation
Exam 1: What Is Statistics39 Questions
Exam 2: Graphical and Tabular Descriptive Techniques192 Questions
Exam 3: Numerical Descriptive Techniques215 Questions
Exam 4: Data Collection and Sampling82 Questions
Exam 5: Probability200 Questions
Exam 6: Random Variables and Discrete Probability Distributions158 Questions
Exam 7: Continuous Probability Distributions149 Questions
Exam 8: Sampling Distributions127 Questions
Exam 9: Introduction to Estimation85 Questions
Exam 10: Introduction to Hypothesis Testing178 Questions
Exam 11: Inference About a Population75 Questions
Exam 12: Inference About Comparing Two Populations, Part 183 Questions
Exam 13: Inference About Comparing Two Populations, Part 284 Questions
Exam 14: Analysis of Variance125 Questions
Exam 15: Chi-Squared Tests118 Questions
Exam 16: Simple Linear Regression and Correlation231 Questions
Exam 17: Multiple Regression143 Questions
Exam 18: Review of Statistical Inference182 Questions
Select questions type
In the simple linear regression model, the y-intercept represents the:
(Multiple Choice)
4.9/5  (41)
(41)
Determine the standard error of estimate and describe what this statistic tells you.
(Essay)
4.8/5 (45)
Car Speed and Gas Mileage: An economist wanted to analyze the relationship between the speed of a car (x) and its gas mileage (y). As an experiment a car is operated at several different speeds and for each speed the gas mileage is measured. These data are shown below.
 -Calculate the Pearson coefficient of correlation.
(Essay)
4.9/5 (34)
The degrees of freedom for the test statistic for the slope is ____________________.
(Short Answer)
4.8/5 (31)
Game Winnings & Education: An ardent fan of television game shows has observed that, in general, the more educated the contestant, the less money he or she wins. To test her belief she gathers data about the last eight winners of her favorite game show. She records their winnings in dollars and the number of years of education. The results are as follows.
 -Estimate with 95% confidence the average winnings of all contestants who have 10 years of education.
(Essay)
4.9/5 (24)
A regression analysis between sales (in $1,000) and advertising (in $1,000) resulted in the following least squares line:  . This implies that:
(Multiple Choice)
4.8/5 (32)
A prediction interval is used when we want to predict a one-time occurrence for a particular value of y when the independent variable is a given x value.
(True/False)
4.8/5 (40)
In regression analysis, the coefficient of determination R2 measures the amount of variation in y that is:
(Multiple Choice)
4.8/5 (34)
In a simple linear regression model, testing whether the slope 1 of the population regression line could be zero is the same as testing whether or not the population coefficient of correlation equals zero.
(True/False)
4.8/5 (36)
Truck Speed vs Gas Mileage: An economist wanted to analyze the relationship between the speed of a car (x) and its gas mileage (y). As an experiment a car is operated at several different speeds and for each speed the gas mileage is measured. These data are shown below.
 -Determine the least squares regression line.
(Essay)
4.8/5 (26)
Which of the following statistics and procedures can be used to determine whether a linear model should be employed?
(Multiple Choice)
4.8/5 (38)
Suppose the slope of a simple linear regression line between hours studying and exam score is 5. That means as ____________________ increases by one, ____________________ increases by 5.
(Short Answer)
4.7/5 (32)
Truck Speed vs Gas Mileage: An economist wanted to analyze the relationship between the speed of a car (x) and its gas mileage (y). As an experiment a car is operated at several different speeds and for each speed the gas mileage is measured. These data are shown below.
-A scatter diagram includes the following data points:
 Two regression models are proposed: (1)
  , and (2)
  . Using the least squares method, which of these regression models provides the better fit to the data? Why?
(Essay)
4.8/5 (31)
Allman Brothers Concert: At a recent Allman Brothers concert, a survey was conducted that asked a random sample of 20 people their age and how many concerts they have attended since the first of the year. The following data were collected:
 An Excel output follows:
 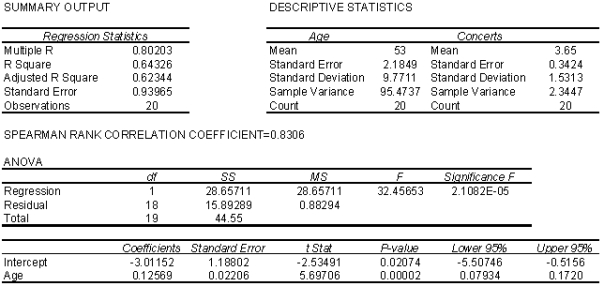 -Plot the least squares regression line on the scatter diagram.
(Essay)
4.8/5 (34)
If the standard error of estimate s = 20 and n = 10, then the sum of squares for error, SSE, is:
(Multiple Choice)
5.0/5 (46)
Rock Concert Revenues: A financier whose specialty is investing in rock concerts has observed that, in general, concerts with "big-name" stars seem to generate more revenue than those concerts whose stars are less well known. To examine his belief he records the gross revenue and the payment (in $ millions) given to the two highest-paid performers in the concert for ten concert tours.
 -Conduct a test of the population coefficient of correlation to determine at the 5% significance level whether a positive linear relationship exists between payment to the two highest-paid performers and gross revenue.
(Essay)
4.9/5 (32)
Rock Concert Revenues: A financier whose specialty is investing in rock concerts has observed that, in general, concerts with "big-name" stars seem to generate more revenue than those concerts whose stars are less well known. To examine his belief he records the gross revenue and the payment (in $ millions) given to the two highest-paid performers in the concert for ten concert tours.
-Determine the standard error of estimate and describe what this statistic tells you about the regression line.
(Essay)
4.7/5 (35)
Cost of Books: The editor of a major academic book publisher claims that a large part of the cost of books is the cost of paper. This implies that larger books will cost more money. As an experiment to analyze the claim, a university student visits the bookstore and records the number of pages and the selling price of twelve randomly selected books. These data are listed below.
 -Determine the coefficient of determination and discuss what its value tells you.
(Essay)
4.8/5 (42)
The vertical spread of the data points about the regression line is measured by the y-intercept.
(True/False)
4.9/5 (38)
Theatre Revenues: A financier whose specialty is investing in stage productions has observed that, in general, movies with "big-name" stars seem to generate more revenue than those plays whose stars are less well known. To examine his belief he records the gross revenue and the payment (in $ millions) given to the two highest-paid performers in the play for ten recently staged plays.
 -Interpret the value of the slope of the regression line.
(Essay)
4.9/5 (35)
Filters
- Essay(0)
- Multiple Choice(0)
- Short Answer(0)
- True False(0)
- Matching(0)