Exam 16: Simple Linear Regression and Correlation
Exam 1: What Is Statistics39 Questions
Exam 2: Graphical and Tabular Descriptive Techniques192 Questions
Exam 3: Numerical Descriptive Techniques215 Questions
Exam 4: Data Collection and Sampling82 Questions
Exam 5: Probability200 Questions
Exam 6: Random Variables and Discrete Probability Distributions158 Questions
Exam 7: Continuous Probability Distributions149 Questions
Exam 8: Sampling Distributions127 Questions
Exam 9: Introduction to Estimation85 Questions
Exam 10: Introduction to Hypothesis Testing178 Questions
Exam 11: Inference About a Population75 Questions
Exam 12: Inference About Comparing Two Populations, Part 183 Questions
Exam 13: Inference About Comparing Two Populations, Part 284 Questions
Exam 14: Analysis of Variance125 Questions
Exam 15: Chi-Squared Tests118 Questions
Exam 16: Simple Linear Regression and Correlation231 Questions
Exam 17: Multiple Regression143 Questions
Exam 18: Review of Statistical Inference182 Questions
Select questions type
Trivia Games & Education: An ardent fan of television game shows has observed that, in general, the more educated the contestant, the less money he or she wins. To test her belief she gathers data about the last eight winners of her favorite game show. She records their winnings in dollars and the number of years of education. The results are as follows.
 -Draw a scatter diagram of the data. Comment on whether it appears that a linear model might be appropriate.
(Essay)
4.9/5  (37)
(37)
Game Winnings & Education: An ardent fan of television game shows has observed that, in general, the more educated the contestant, the less money he or she wins. To test her belief she gathers data about the last eight winners of her favorite game show. She records their winnings in dollars and the number of years of education. The results are as follows.
 -Predict with 95% confidence the winnings of a contestant who has 15 years of education.
(Essay)
4.9/5 (34)
Income and Education: A professor of economics wants to study the relationship between income (y in $1000s) and education (x in years). A random sample eight individuals is taken and the results are shown below.
 -Determine the least squares regression line.
(Essay)
4.8/5 (31)
Oil Quality and Price: Quality of oil is measured in API gravity degrees--the higher the degrees API, the higher the quality. The table shown below is produced by an expert in the field who believes that there is a relationship between quality and price per barrel.
 A partial Minitab output follows:


 -Estimate with 95% confidence the average oil price per barrel for an API degree of 35.
(Essay)
4.7/5 (33)
The unbiased estimator of the variance of the error variable is found by taking ____________________ divided by n - 2.
(Short Answer)
4.9/5 (37)
Game Winnings & Education: An ardent fan of television game shows has observed that, in general, the more educated the contestant, the less money he or she wins. To test her belief she gathers data about the last eight winners of her favorite game show. She records their winnings in dollars and the number of years of education. The results are as follows.
-Estimate with 95% confidence the average winnings of all contestants who have 15 years of education.
(Essay)
4.8/5 (36)
The graph of a confidence interval for the expected value of y is represented by two parallel lines, one on either side of the regression line.
(True/False)
4.8/5 (39)
Allman Brothers Concert: At a recent Allman Brothers concert, a survey was conducted that asked a random sample of 20 people their age and how many concerts they have attended since the first of the year. The following data were collected:
 An Excel output follows:
 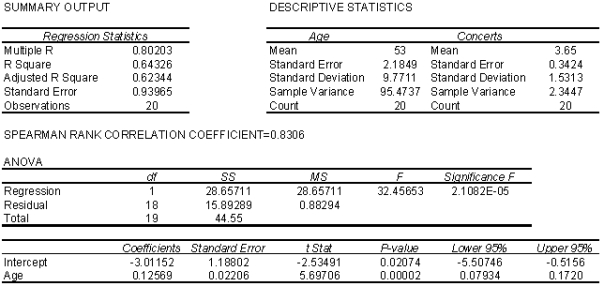 -Estimate the number of Allman Brothers concerts attended by a 64 year old person.
(Essay)
4.8/5 (29)
If the value of the sum of squares for error SSE equals zero, then the coefficient of determination must equal zero.
(True/False)
4.8/5 (30)
Sunshine and Melanoma: A medical researcher wanted to examine the relationship between the amount of sunshine (x) in hours, and incidence of melanoma, a type of skin cancer (y). As an experiment he found the number of melanoma cases detected per 100,000 of population and the average daily sunshine in eight counties around the country. These data are shown below.
 -What does the value of the slope of the regression line tell you?
(Essay)
4.9/5 (36)
In regression analysis, if the coefficient of determination is 1.0, then:
(Multiple Choice)
4.7/5 (35)
If the coefficient of correlation is -0.80, then the percentage of the variation in y that is explained by the variation in x is:
(Multiple Choice)
5.0/5 (39)
Oil Quality and Price: Quality of oil is measured in API gravity degrees--the higher the degrees API, the higher the quality. The table shown below is produced by an expert in the field who believes that there is a relationship between quality and price per barrel.
A partial Minitab output follows:
-Interpret the value of the slope of the regression line.
(Essay)
4.9/5 (34)
Oil Quality and Price: Quality of oil is measured in API gravity degrees--the higher the degrees API, the higher the quality. The table shown below is produced by an expert in the field who believes that there is a relationship between quality and price per barrel.
A partial Minitab output follows:
-Plot the least squares regression line on the scatter diagram.
(Essay)
4.8/5 (32)
Allman Brothers Concert: At a recent Allman Brothers concert, a survey was conducted that asked a random sample of 20 people their age and how many concerts they have attended since the first of the year. The following data were collected:
An Excel output follows:
-Interpret the value of the slope of the regression line.
(Essay)
4.8/5 (34)
Sales and Experience: The general manager of a chain of hardware stores believes that experience is the most important factor in determining the level of success of a salesperson. To examine this belief she records last month's sales (in $1,000s) and the years of experience of 10 randomly selected salespeople. These data are listed below.
 -Determine the standard error of estimate and describe what this statistic tells you about the regression line.
(Essay)
4.8/5 (43)
Truck Speed vs Gas Mileage: An economist wanted to analyze the relationship between the speed of a car (x) and its gas mileage (y). As an experiment a car is operated at several different speeds and for each speed the gas mileage is measured. These data are shown below.
 -Estimate the gas mileage of a car traveling 70 mph.
(Essay)
4.7/5 (34)
Game Show Winnings & Education: An ardent fan of television game shows has observed that, in general, the more educated the contestant, the less money he or she wins. To test her belief she gathers data about the last eight winners of her favorite game show. She records their winnings in dollars and the number of years of education. The results are as follows.
 -Determine the coefficient of determination and discuss what its value tells you about the two variables.
(Essay)
4.9/5 (38)
Filters
- Essay(0)
- Multiple Choice(0)
- Short Answer(0)
- True False(0)
- Matching(0)