Exam 4: Linear Regression With One Regressor
Exam 1: Economic Questions and Data17 Questions
Exam 2: Review of Probability71 Questions
Exam 3: Review of Statistics63 Questions
Exam 4: Linear Regression With One Regressor65 Questions
Exam 5: Regression With a Single Regressor: Hypothesis Tests and Confidence Intervals59 Questions
Exam 6: Linear Regression With Multiple Regressors65 Questions
Exam 7: Hypothesis Tests and Confidence Intervals in Multiple Regression65 Questions
Exam 8: Nonlinear Regression Functions62 Questions
Exam 9: Assessing Studies Based on Multiple Regression65 Questions
Exam 10: Regression With Panel Data50 Questions
Exam 11: Regression With a Binary Dependent Variable50 Questions
Exam 12: Instrumental Variables Regression50 Questions
Exam 13: Experiments and Quasi-Experiments50 Questions
Exam 14: Introduction to Time Series Regression and Forecasting50 Questions
Exam 15: Estimation of Dynamic Causal Effects50 Questions
Exam 16: Additional Topics in Time Series Regression50 Questions
Exam 17: The Theory of Linear Regression With One Regressor49 Questions
Exam 18: The Theory of Multiple Regression50 Questions
Select questions type
To obtain the slope estimator using the least squares principle,you divide the
(Multiple Choice)
4.9/5  (36)
(36)
A peer of yours,who is a major in another social science,says he is not interested in the regression slope and/or intercept.Instead he only cares about correlations.For example,in the testscore/student-teacher ratio regression,he claims to get all the information he needs from the negative correlation coefficient corr(X,Y)=-0.226.What response might you have for your peer?
(Essay)
4.9/5 (34)
(Requires Appendix material)Consider the sample regression function 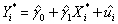 ,
where * indicates that the variable has been standardized.What are the units of measurement for the dependent and explanatory variable? Why would you want to transform both variables in this way? Show that the OLS estimator for the intercept equals zero.Next prove that the OLS estimator for the slope in this case is identical to the formula for the least squares estimator where the variables have not been standardized,times the ratio of the sample standard deviation of X and Y,i.e. ,
,
where * indicates that the variable has been standardized.What are the units of measurement for the dependent and explanatory variable? Why would you want to transform both variables in this way? Show that the OLS estimator for the intercept equals zero.Next prove that the OLS estimator for the slope in this case is identical to the formula for the least squares estimator where the variables have not been standardized,times the ratio of the sample standard deviation of X and Y,i.e. ,  .
.
(Essay)
4.9/5 (35)
You have analyzed the relationship between the weight and height of individuals.Although you are quite confident about the accuracy of your measurements,you feel that some of the observations are extreme,say,two standard deviations above and below the mean.Your therefore decide to disregard these individuals.What consequence will this have on the standard deviation of the OLS estimator of the slope?
(Essay)
4.8/5 (27)
(Requires Appendix material)Which of the following statements is correct?
(Multiple Choice)
4.8/5 (30)
The news-magazine The Economist regularly publishes data on the so called Big Mac index and exchange rates between countries.The data for 30 countries from the April 29,2000 issue is listed below:
Price of Actual Exchange Rate
Country Currency Big Mac per U.S.dollar
Indonesia Rupiah 14,500 7,945
Italy Lira 4,500 2,088
South Korea Won 3,000 1,108
Chile Peso 1,260 514
Spain Peseta 375 179
Hungary Forint 339 279
Japan Yen 294 106
Taiwan Dollar 70 30.6
Thailand Baht 55 38.0
Czech Rep.Crown 54.37 39.1
Russia Ruble 39.50 28.5
Denmark Crown 24.75 8.04
Sweden Crown 24.0 8.84
Mexico Peso 20.9 9.41
France Franc 18.5 .07
Israel Shekel 14.5 4.05
China Yuan 9.90 8.28
South Africa Rand 9.0 6.72
Switzerland Franc 5.90 1.70
Poland Zloty 5.50 4.30
Germany Mark 4.99 2.11
Malaysia Dollar 4.52 3.80
New Zealand Dollar 3.40 2.01
Singapore Dollar 3.20 1.70
Brazil Real 2.95 1.79
Canada Dollar 2.85 1.47
Australia Dollar 2.59 1.68
Argentina Peso 2.50 1.00
Britain Pound 1.90 0.63
United States Dollar 2.51
The concept of purchasing power parity or PPP ("the idea that similar foreign and domestic goods … should have the same price in terms of the same currency," Abel,A.and B.Bernanke,Macroeconomics,4th edition,Boston: Addison Wesley,476)suggests that the ratio of the Big Mac priced in the local currency to the U.S.dollar price should equal the exchange rate between the two countries.
(a)Enter the data into your regression analysis program (EViews,Stata,Excel,SAS,etc. ).Calculate the predicted exchange rate per U.S.dollar by dividing the price of a Big Mac in local currency by the U.S.price of a Big Mac ($2.51).
(b)Run a regression of the actual exchange rate on the predicted exchange rate.If purchasing power parity held,what would you expect the slope and the intercept of the regression to be? Is the value of the slope and the intercept "far" from the values you would expect to hold under PPP?
(c)Plot the actual exchange rate against the predicted exchange rate.Include the 45 degree line in your graph.Which observations might cause the slope and the intercept to differ from zero and one?
(Essay)
5.0/5 (41)
In the linear regression model,Yi = β0 + β1Xi + ui,β0 + β1Xi is referred to as
(Multiple Choice)
5.0/5 (50)
At the Stock and Watson (http://www.pearsonhighered.com/stock_watson)website,go to Student Resources and select the option "Datasets for Replicating Empirical Results." Then select the "California Test Score Data Used in Chapters 4-9" and read the data either into Excel or STATA (or another statistical program).First run a regression where the dependent variable is test scores and the independent variable is the student-teacher ratio.Record the regression R2.Then run a regression where the dependent variable is the student-teacher ratio and the independent variable is test scores.Record the regression R2 from this regression.How do they compare?
(Essay)
5.0/5 (36)
Given the amount of money and effort that you have spent on your education,you wonder if it was (is)all worth it.You therefore collect data from the Current Population Survey (CPS)and estimate a linear relationship between earnings and the years of education of individuals.What would be the effect on your regression slope and intercept if you measured earnings in thousands of dollars rather than in dollars? Would the regression R2 be affected? Should statistical inference be dependent on the scale of variables? Discuss.
(Essay)
4.8/5 (35)
(Requires Appendix material)In deriving the OLS estimator,you minimize the sum of squared residuals with respect to the two parameters  0 and
0 and  1.The resulting two equations imply two restrictions that OLS places on the data,namely that
  and
and  .Show that you get the same formula for the regression slope and the intercept if you impose these two conditions on the sample regression function.
(Essay)
4.9/5 (32)
(Requires Appendix)The sample average of the OLS residuals is
(Multiple Choice)
4.9/5 (41)
The OLS slope estimator is not defined if there is no variation in the data for the explanatory variable.You are interested in estimating a regression relating earnings to years of schooling.Imagine that you had collected data on earnings for different individuals,but that all these individuals had completed a college education (16 years of education).Sketch what the data would look like and explain intuitively why the OLS coefficient does not exist in this situation.
(Essay)
4.8/5 (38)
To decide whether or not the slope coefficient is large or small,
(Multiple Choice)
4.8/5 (31)
Imagine that you had discovered a relationship that would generate a scatterplot very similar to the relationship Yi =  ,and that you would try to fit a linear regression through your data points.What do you expect the slope coefficient to be? What do you think the value of your regression R2 is in this situation? What are the implications from your answers in terms of fitting a linear regression through a non-linear relationship?
(Essay)
4.8/5 (43)
(Requires Appendix material)At a recent county fair,you observed that at one stand people's weight was forecasted,and were surprised by the accuracy (within a range).Thinking about how the person could have predicted your weight fairly accurately (despite the fact that she did not know about your "heavy bones"),you think about how this could have been accomplished.You remember that medical charts for children contain 5%,25%,50%,75% and 95% lines for a weight/height relationship and decide to conduct an experiment with 110 of your peers.You collect the data and calculate the following sums: 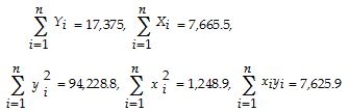 where the height is measured in inches and weight in pounds.(Small letters refer to deviations from means as in zi = Zi -
  )
(a)Calculate the slope and intercept of the regression and interpret these.
(b)Find the regression R2 and explain its meaning.What other factors can you think of that might have an influence on the weight of an individual?
)
(a)Calculate the slope and intercept of the regression and interpret these.
(b)Find the regression R2 and explain its meaning.What other factors can you think of that might have an influence on the weight of an individual?
(Essay)
4.9/5 (35)
Filters
- Essay(0)
- Multiple Choice(0)
- Short Answer(0)
- True False(0)
- Matching(0)