Exam 4: Linear Regression With One Regressor
Exam 1: Economic Questions and Data17 Questions
Exam 2: Review of Probability71 Questions
Exam 3: Review of Statistics63 Questions
Exam 4: Linear Regression With One Regressor65 Questions
Exam 5: Regression With a Single Regressor: Hypothesis Tests and Confidence Intervals59 Questions
Exam 6: Linear Regression With Multiple Regressors65 Questions
Exam 7: Hypothesis Tests and Confidence Intervals in Multiple Regression65 Questions
Exam 8: Nonlinear Regression Functions62 Questions
Exam 9: Assessing Studies Based on Multiple Regression65 Questions
Exam 10: Regression With Panel Data50 Questions
Exam 11: Regression With a Binary Dependent Variable50 Questions
Exam 12: Instrumental Variables Regression50 Questions
Exam 13: Experiments and Quasi-Experiments50 Questions
Exam 14: Introduction to Time Series Regression and Forecasting50 Questions
Exam 15: Estimation of Dynamic Causal Effects50 Questions
Exam 16: Additional Topics in Time Series Regression50 Questions
Exam 17: The Theory of Linear Regression With One Regressor49 Questions
Exam 18: The Theory of Multiple Regression50 Questions
Select questions type
Show first that the regression R2 is the square of the sample correlation coefficient.Next,show that the slope of a simple regression of Y on X is only identical to the inverse of the regression slope of X on Y if the regression R2 equals one.
(Essay)
4.8/5  (31)
(31)
(Requires Appendix material)Show that the two alternative formulae for the slope given in your textbook are identical. 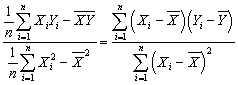
(Essay)
4.9/5 (42)
You have obtained a sub-sample of 1744 individuals from the Current Population Survey (CPS)and are interested in the relationship between weekly earnings and age.The regression,using heteroskedasticity-robust standard errors,yielded the following result:  = 239.16 + 5.20 × Age,R2 = 0.05,SER = 287.21. ,
where Earn and Age are measured in dollars and years respectively.
(a)Interpret the results.
(b)Is the effect of age on earnings large?
(c)Why should age matter in the determination of earnings? Do the results suggest that there is a guarantee for earnings to rise for everyone as they become older? Do you think that the relationship between age and earnings is linear?
(d)The average age in this sample is 37.5 years.What is annual income in the sample?
(e)Interpret the measures of fit.
= 239.16 + 5.20 × Age,R2 = 0.05,SER = 287.21. ,
where Earn and Age are measured in dollars and years respectively.
(a)Interpret the results.
(b)Is the effect of age on earnings large?
(c)Why should age matter in the determination of earnings? Do the results suggest that there is a guarantee for earnings to rise for everyone as they become older? Do you think that the relationship between age and earnings is linear?
(d)The average age in this sample is 37.5 years.What is annual income in the sample?
(e)Interpret the measures of fit.
(Essay)
5.0/5 (27)
You have learned in one of your economics courses that one of the determinants of per capita income (the "Wealth of Nations")is the population growth rate.Furthermore you also found out that the Penn World Tables contain income and population data for 104 countries of the world.To test this theory,you regress the GDP per worker (relative to the United States)in 1990 (RelPersInc)on the difference between the average population growth rate of that country (n)to the U.S.average population growth rate (nus )for the years 1980 to 1990.This results in the following regression output:  = 0.518 - 18.831 × 18.831 × (n - nus),R2 = 0.522,SER = 0.197
(a)Interpret the results carefully.Is this relationship economically important?
(b)What would happen to the slope,intercept,and regression R2 if you ran another regression where the above explanatory variable was replaced by n only,i.e. ,the average population growth rate of the country? (The population growth rate of the United States from 1980 to 1990 was 0.009. )Should this have any effect on the t-statistic of the slope?
(c)31 of the 104 countries have a dependent variable of less than 0.10.Does it therefore make sense to interpret the intercept?
= 0.518 - 18.831 × 18.831 × (n - nus),R2 = 0.522,SER = 0.197
(a)Interpret the results carefully.Is this relationship economically important?
(b)What would happen to the slope,intercept,and regression R2 if you ran another regression where the above explanatory variable was replaced by n only,i.e. ,the average population growth rate of the country? (The population growth rate of the United States from 1980 to 1990 was 0.009. )Should this have any effect on the t-statistic of the slope?
(c)31 of the 104 countries have a dependent variable of less than 0.10.Does it therefore make sense to interpret the intercept?
(Essay)
4.9/5 (42)
Multiplying the dependent variable by 100 and the explanatory variable by 100,000 leaves the
(Multiple Choice)
4.9/5 (41)
Filters
- Essay(0)
- Multiple Choice(0)
- Short Answer(0)
- True False(0)
- Matching(0)