Exam 18: The Genetic and Environmental Basis of Complex Traits
Exam 1: Life: Chemical, Cellular, and Evolutionary Foundations160 Questions
Exam 2: The Molecules of Life232 Questions
Exam 3: Nucleic Acids and Transcription186 Questions
Exam 4: Translation and Protein Structure148 Questions
Exam 5: Organizing Principles: Lipids, Membranes, and Cell Compartments193 Questions
Exam 6: Making Life Work: Capturing and Using Energy152 Questions
Exam 7: Cellular Respiration: Harvesting Energy From Carbohydrates and Other Fuel Molecules203 Questions
Exam 8: Photosynthesis: Using Sunlight to Build Carbohydrates204 Questions
Exam 9: Cell Signaling148 Questions
Exam 10: Cell and Tissue Architecture: Cytoskeleton, Cell Junctions, and Extracellular Matrix145 Questions
Exam 11: Cell Division: Variations, Regulation, and Cancer169 Questions
Exam 12: Dna Replication and Manipulation169 Questions
Exam 13: Genomes193 Questions
Exam 14: Mutation and Dna Repair165 Questions
Exam 15: Genetic Variation172 Questions
Exam 16: Mendelian Inheritance191 Questions
Exam 17: Inheritance of Sex Chromosomes, Linked Genes, and Organelles201 Questions
Exam 18: The Genetic and Environmental Basis of Complex Traits164 Questions
Exam 19: Genetic and Epigenetic Regulation189 Questions
Exam 20: Genes and Development201 Questions
Exam 21: Evolution: How Genotypes and Phenotypes Change Over Time182 Questions
Exam 22: Species and Speciation132 Questions
Exam 23: Evolutionary Patterns: Phylogeny and Fossils154 Questions
Exam 24: Human Origins and Evolution178 Questions
Exam 25: Cycling Carbon116 Questions
Exam 26: Bacteria and Archaea186 Questions
Exam 27: Eukaryotic Cells: Origins and Diversity153 Questions
Exam 28: Being Multicellular163 Questions
Exam 29: Plant Structure and Function: Moving Photosynthesis Onto Land179 Questions
Exam 30: Plant Reproduction: Finding Mates and Dispersing Young146 Questions
Exam 31: Plant Growth and Development187 Questions
Exam 32: Plant Defense: Keeping the World Green164 Questions
Exam 33: Plant Diversity148 Questions
Exam 34: Fungi: Structure, Function, and Diversity135 Questions
Exam 35: Animal Nervous Systems157 Questions
Exam 36: Animal Sensory Systems and Brain Function205 Questions
Exam 37: Animal Movement: Muscles and Skeletons175 Questions
Exam 38: Animal Endocrine Systems126 Questions
Exam 39: Animal Cardiovascular and Respiratory Systems153 Questions
Exam 40: Animal Metabolism, Nutrition, and Digestion172 Questions
Exam 41: Animal Renal Systems: Water and Waste150 Questions
Exam 42: Animal Reproduction and Development196 Questions
Exam 43: Animal Immune Systems169 Questions
Exam 44: Animal Diversity195 Questions
Exam 45: Animal Behavior186 Questions
Exam 46: Population Ecology132 Questions
Exam 47: Species Interactions, Communities, and Ecosystems178 Questions
Exam 48: Biomes and Global Ecology126 Questions
Exam 49: The Anthropocene: Humans As a Planetary Force192 Questions
Select questions type
One reason that the effects of individual genes on complex traits can be difficult to determine is that:
(Multiple Choice)
4.7/5  (42)
(42)
Consider Figure 18.11, below, which shows the incidence of the most common birth anomalies. Why does the pie chart NOT include behavioral disorders such as autism spectrum disorder? 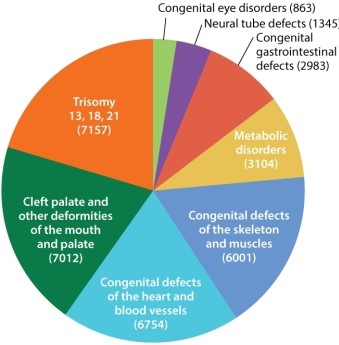
(Multiple Choice)
4.8/5 (33)
Consider a simple Mendelian trait that is due to a single gene with alleles A and a. In one environment, allele A is dominant, whereas in a different environment allele a is dominant. This is an example of:
(Multiple Choice)
4.9/5 (34)
For which of the following traits do genetic risk factors transmitted from parent to offspring NOT play a major role in the development of the trait?
(Multiple Choice)
4.8/5 (36)
A scientist measured heritability in yield per acre of a strain of wheat grown on a farm in eastern Europe and determined that it was 80%. She can therefore conclude that:
(Multiple Choice)
4.9/5 (38)
If all variation among individuals in a population is due to differing environments, heritability is _____, and the slope of the line used to measure it is _____.
(Multiple Choice)
4.8/5 (41)
Five varieties of hybrid corn are studied for average yield of corn (the phenotype) as a function of annual rainfall (the environment), with the results shown here. 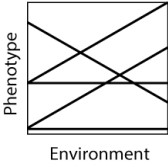 Each of these lines constitutes a:
(Multiple Choice)
4.8/5 (28)
Red coloration in wheat seeds is a complex trait influenced by three unlinked genes, each with two different alleles A and a; B and b; C and c. This Punnett square shows the results of a mating between two plants that are both heterozygous at all three genes. 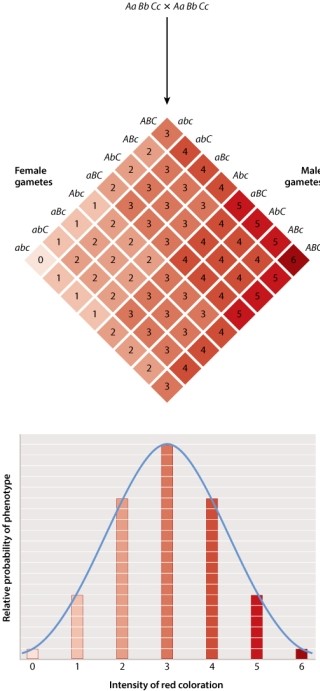 Each dominant allele, represented by an uppercase letter, contributes to the red coloration.
(True/False)
4.9/5 (40)
Sunlight exposure has stronger effect on skin cancer risk in fair-skinned humans than in individuals with darker skin. This is an example of:
(Multiple Choice)
4.8/5 (29)
Identification and location of genes on chromosomes that might affect cholesterol metabolism has been difficult because many of the genes that affect this trait interact, a phenomenon that is called epistasis.
(True/False)
4.7/5 (35)
In the graph of Galton's height data below, which line on the graph represents the population mean? 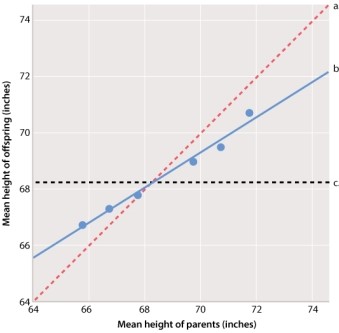
(Multiple Choice)
4.8/5 (39)
Clustering of genes with related functions on the same chromosome reflects the fact that many genes arose through the process of duplication of a single gene, followed by divergence.
(True/False)
4.8/5 (46)
An example of "regression toward the mean" would be if the offspring of two short parents had an average height equal to the average height of the parentsnot of the population as a whole.
(True/False)
4.9/5 (31)
Some tentative patterns that are emerging from the study of complex traits are that:
(Multiple Choice)
4.7/5 (44)
The phenotypes of complex traits vary with both genotype and environment. An important implication of this is that:
(Multiple Choice)
4.8/5 (36)
The data in the graph below show the concordance between identical twins (monozygotic) and same-sex fraternal twins (dizygotic) for five complex traits. Based on these data, which of the traits shows the GREATEST effect of environment relative to heredity? 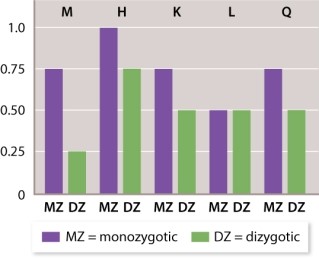
(Multiple Choice)
4.9/5 (38)
The overall results represented in Figure 18.7 suggest that offspring exhibit an average phenotype that is more different from the population mean than that of their parents. 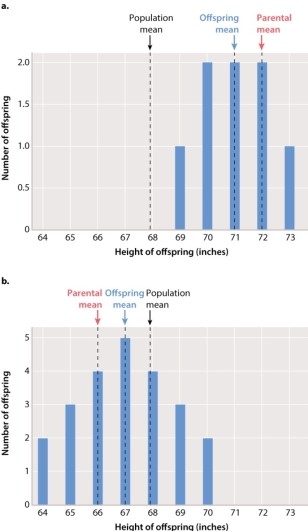
(True/False)
4.8/5 (35)
Filters
- Essay(0)
- Multiple Choice(0)
- Short Answer(0)
- True False(0)
- Matching(0)