Exam 18: The Genetic and Environmental Basis of Complex Traits
Exam 1: Life: Chemical, Cellular, and Evolutionary Foundations160 Questions
Exam 2: The Molecules of Life232 Questions
Exam 3: Nucleic Acids and Transcription186 Questions
Exam 4: Translation and Protein Structure148 Questions
Exam 5: Organizing Principles: Lipids, Membranes, and Cell Compartments193 Questions
Exam 6: Making Life Work: Capturing and Using Energy152 Questions
Exam 7: Cellular Respiration: Harvesting Energy From Carbohydrates and Other Fuel Molecules203 Questions
Exam 8: Photosynthesis: Using Sunlight to Build Carbohydrates204 Questions
Exam 9: Cell Signaling148 Questions
Exam 10: Cell and Tissue Architecture: Cytoskeleton, Cell Junctions, and Extracellular Matrix145 Questions
Exam 11: Cell Division: Variations, Regulation, and Cancer169 Questions
Exam 12: Dna Replication and Manipulation169 Questions
Exam 13: Genomes193 Questions
Exam 14: Mutation and Dna Repair165 Questions
Exam 15: Genetic Variation172 Questions
Exam 16: Mendelian Inheritance191 Questions
Exam 17: Inheritance of Sex Chromosomes, Linked Genes, and Organelles201 Questions
Exam 18: The Genetic and Environmental Basis of Complex Traits164 Questions
Exam 19: Genetic and Epigenetic Regulation189 Questions
Exam 20: Genes and Development201 Questions
Exam 21: Evolution: How Genotypes and Phenotypes Change Over Time182 Questions
Exam 22: Species and Speciation132 Questions
Exam 23: Evolutionary Patterns: Phylogeny and Fossils154 Questions
Exam 24: Human Origins and Evolution178 Questions
Exam 25: Cycling Carbon116 Questions
Exam 26: Bacteria and Archaea186 Questions
Exam 27: Eukaryotic Cells: Origins and Diversity153 Questions
Exam 28: Being Multicellular163 Questions
Exam 29: Plant Structure and Function: Moving Photosynthesis Onto Land179 Questions
Exam 30: Plant Reproduction: Finding Mates and Dispersing Young146 Questions
Exam 31: Plant Growth and Development187 Questions
Exam 32: Plant Defense: Keeping the World Green164 Questions
Exam 33: Plant Diversity148 Questions
Exam 34: Fungi: Structure, Function, and Diversity135 Questions
Exam 35: Animal Nervous Systems157 Questions
Exam 36: Animal Sensory Systems and Brain Function205 Questions
Exam 37: Animal Movement: Muscles and Skeletons175 Questions
Exam 38: Animal Endocrine Systems126 Questions
Exam 39: Animal Cardiovascular and Respiratory Systems153 Questions
Exam 40: Animal Metabolism, Nutrition, and Digestion172 Questions
Exam 41: Animal Renal Systems: Water and Waste150 Questions
Exam 42: Animal Reproduction and Development196 Questions
Exam 43: Animal Immune Systems169 Questions
Exam 44: Animal Diversity195 Questions
Exam 45: Animal Behavior186 Questions
Exam 46: Population Ecology132 Questions
Exam 47: Species Interactions, Communities, and Ecosystems178 Questions
Exam 48: Biomes and Global Ecology126 Questions
Exam 49: The Anthropocene: Humans As a Planetary Force192 Questions
Select questions type
The scatterplots below show the relation between the average phenotype of parents (x-axis) and that of their offspring (y-axis) for three traits. One trait has a heritability of 90% (comparable to that of fingerprint ridge count), another has a heritability of 50% (comparable to that of human height), and yet another has a heritability of 25% (comparable to that of human longevity). To make the axes comparable, for each trait the phenotypic measurement is expressed as a deviation from the overall mean in multiples of the standard deviation.
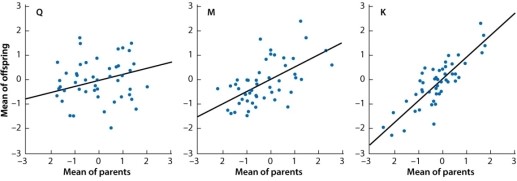 The fact that all of the lines slope upward means that:
(Multiple Choice)
4.8/5  (31)
(31)
If the value of the trait in 16% of the population is equal to 6 or greater, in what percentage of the population is the value of the trait greater than 4?
(Multiple Choice)
4.8/5 (38)
The plots shown here depict several possible outcomes of an experiment comparing the mean phenotype of a behavioral trait in two strains of mice in three environments. Strain 1 is represented by filled circles and Strain 2 is represented by open circles. Environment 1 (E1) is deficient in stimulation for the behavior, environment 2 (E2) has an average level of stimulation, and environment 3 (E3) is enriched in stimulation. Which of the possible results indicates the absence of genotype-by-environment interaction? 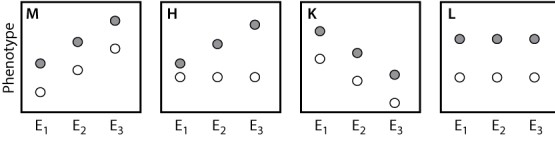
(Multiple Choice)
4.9/5 (36)
Red coloration in wheat seeds is a complex trait influenced by three unlinked genes, each with two different alleles A and a; B and b; C and c. This Punnett square shows the results of a mating between two plants that are both heterozygous at all three loci. 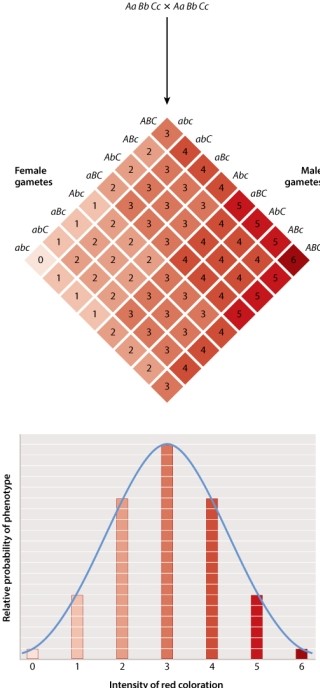 The intensity of the red color phenotype is influenced by only one of the gene products.
(True/False)
4.7/5 (34)
When differences in the phenotype due to the environment can be ignored:
(Multiple Choice)
4.7/5 (39)
In which of the complex traits shown here is variation determined almost completely by heredity? 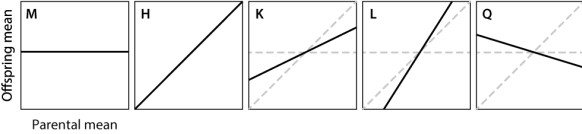
(Multiple Choice)
4.9/5 (33)
Which of the traits depicted here illustrates regression toward the mean? 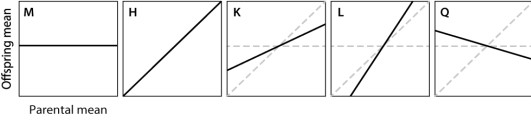
(Multiple Choice)
4.8/5 (39)
Studies have shown that 5%-10% of all breast cancers are related to mutations in BRCA1 and BRCA2. A logical conclusion from these data is that:
(Multiple Choice)
4.9/5 (36)
If the concordance rate for a given trait is 10% for both identical and fraternal twins, this means that:
(Multiple Choice)
4.7/5 (47)
Which of the following traits would you expect to conform to a normal distribution?
(Multiple Choice)
4.9/5 (29)
Which of the graphs below would likely represent the distribution of a simple, single gene trait? 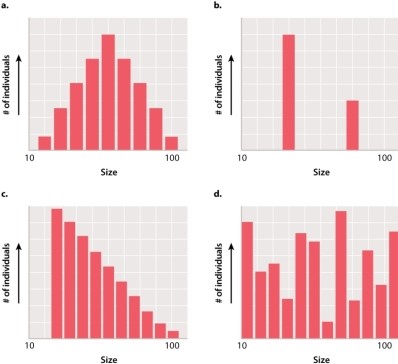
(Multiple Choice)
4.7/5 (35)
Salt intake is associated with an increased likelihood of high blood pressure and is therefore a(n) _____ of this common disorder.
(Multiple Choice)
4.8/5 (38)
Consider a trait determined by a rare, simple Mendelian, autosomal recessive allele. What is the concordance between identical twins? Between same-sex fraternal twins?
(Multiple Choice)
4.8/5 (38)
Personalized medicine matches the treatment to the disease, not to the patient.
(True/False)
4.9/5 (38)
Diets high in fat and carbohydrates affect inbred lines of mice differently. One line becomes obese and the other does not. This is called a _____ interaction.
(Multiple Choice)
4.8/5 (40)
Lindsay and Joy are twins that share the same genetic material and appear so similar that their teachers cannot tell them apart. Lindsay and Joy are _____ twins.
(Multiple Choice)
5.0/5 (30)
The scatterplots show the relation between the average phenotype of parents (x-axis) and that of their offspring (y-axis) for two traits in a variety of tropical sweet corn. One trait is ear height, which has a heritability of 75%; and the other is ear length, which has a heritability of 25%. To make the axes comparable, for each trait the phenotypic measurement is expressed as a deviation from the overall mean in multiples of the standard deviation. Which of the following matchups is CORRECT? 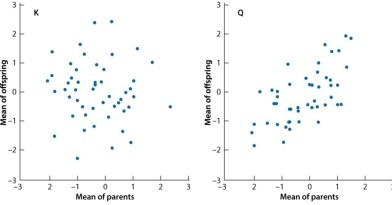
(Multiple Choice)
4.9/5 (33)
Which of the traits depicted here has the SMALLEST heritability? 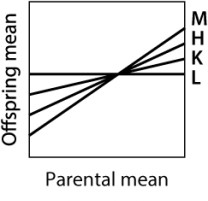
(Multiple Choice)
4.8/5 (42)
Filters
- Essay(0)
- Multiple Choice(0)
- Short Answer(0)
- True False(0)
- Matching(0)