Exam 18: The Genetic and Environmental Basis of Complex Traits
Exam 1: Life: Chemical, Cellular, and Evolutionary Foundations160 Questions
Exam 2: The Molecules of Life232 Questions
Exam 3: Nucleic Acids and Transcription186 Questions
Exam 4: Translation and Protein Structure148 Questions
Exam 5: Organizing Principles: Lipids, Membranes, and Cell Compartments193 Questions
Exam 6: Making Life Work: Capturing and Using Energy152 Questions
Exam 7: Cellular Respiration: Harvesting Energy From Carbohydrates and Other Fuel Molecules203 Questions
Exam 8: Photosynthesis: Using Sunlight to Build Carbohydrates204 Questions
Exam 9: Cell Signaling148 Questions
Exam 10: Cell and Tissue Architecture: Cytoskeleton, Cell Junctions, and Extracellular Matrix145 Questions
Exam 11: Cell Division: Variations, Regulation, and Cancer169 Questions
Exam 12: Dna Replication and Manipulation169 Questions
Exam 13: Genomes193 Questions
Exam 14: Mutation and Dna Repair165 Questions
Exam 15: Genetic Variation172 Questions
Exam 16: Mendelian Inheritance191 Questions
Exam 17: Inheritance of Sex Chromosomes, Linked Genes, and Organelles201 Questions
Exam 18: The Genetic and Environmental Basis of Complex Traits164 Questions
Exam 19: Genetic and Epigenetic Regulation189 Questions
Exam 20: Genes and Development201 Questions
Exam 21: Evolution: How Genotypes and Phenotypes Change Over Time182 Questions
Exam 22: Species and Speciation132 Questions
Exam 23: Evolutionary Patterns: Phylogeny and Fossils154 Questions
Exam 24: Human Origins and Evolution178 Questions
Exam 25: Cycling Carbon116 Questions
Exam 26: Bacteria and Archaea186 Questions
Exam 27: Eukaryotic Cells: Origins and Diversity153 Questions
Exam 28: Being Multicellular163 Questions
Exam 29: Plant Structure and Function: Moving Photosynthesis Onto Land179 Questions
Exam 30: Plant Reproduction: Finding Mates and Dispersing Young146 Questions
Exam 31: Plant Growth and Development187 Questions
Exam 32: Plant Defense: Keeping the World Green164 Questions
Exam 33: Plant Diversity148 Questions
Exam 34: Fungi: Structure, Function, and Diversity135 Questions
Exam 35: Animal Nervous Systems157 Questions
Exam 36: Animal Sensory Systems and Brain Function205 Questions
Exam 37: Animal Movement: Muscles and Skeletons175 Questions
Exam 38: Animal Endocrine Systems126 Questions
Exam 39: Animal Cardiovascular and Respiratory Systems153 Questions
Exam 40: Animal Metabolism, Nutrition, and Digestion172 Questions
Exam 41: Animal Renal Systems: Water and Waste150 Questions
Exam 42: Animal Reproduction and Development196 Questions
Exam 43: Animal Immune Systems169 Questions
Exam 44: Animal Diversity195 Questions
Exam 45: Animal Behavior186 Questions
Exam 46: Population Ecology132 Questions
Exam 47: Species Interactions, Communities, and Ecosystems178 Questions
Exam 48: Biomes and Global Ecology126 Questions
Exam 49: The Anthropocene: Humans As a Planetary Force192 Questions
Select questions type
In the graph of Galton's height data below, which line on the graph represents the mean height of the offspring for a given average height of the mother and father? 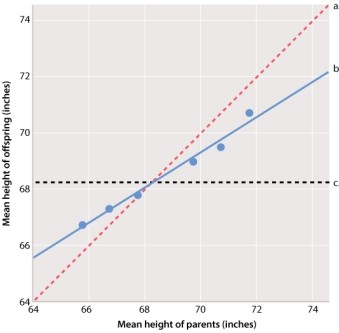
(Multiple Choice)
4.9/5  (30)
(30)
Similar to single gene traits, traits determined by multiple genes also show the expected 3:1 ratio of phenotypes in the progeny between two heterozygotes.
(True/False)
4.8/5 (35)
A farmer in Kansas and a farmer in California each plant an acre of the same variety of corn. Because the environment differs for each field, how will this affect the height of their corn?
(Multiple Choice)
4.9/5 (36)
When the average weight of the parents is smaller than the population mean, what is the average weight of the offspring compared with their parents? Compared with the population?
(Multiple Choice)
4.8/5 (35)
Filters
- Essay(0)
- Multiple Choice(0)
- Short Answer(0)
- True False(0)
- Matching(0)