Exam 18: The Genetic and Environmental Basis of Complex Traits
Exam 1: Life: Chemical, Cellular, and Evolutionary Foundations160 Questions
Exam 2: The Molecules of Life232 Questions
Exam 3: Nucleic Acids and Transcription186 Questions
Exam 4: Translation and Protein Structure148 Questions
Exam 5: Organizing Principles: Lipids, Membranes, and Cell Compartments193 Questions
Exam 6: Making Life Work: Capturing and Using Energy152 Questions
Exam 7: Cellular Respiration: Harvesting Energy From Carbohydrates and Other Fuel Molecules203 Questions
Exam 8: Photosynthesis: Using Sunlight to Build Carbohydrates204 Questions
Exam 9: Cell Signaling148 Questions
Exam 10: Cell and Tissue Architecture: Cytoskeleton, Cell Junctions, and Extracellular Matrix145 Questions
Exam 11: Cell Division: Variations, Regulation, and Cancer169 Questions
Exam 12: Dna Replication and Manipulation169 Questions
Exam 13: Genomes193 Questions
Exam 14: Mutation and Dna Repair165 Questions
Exam 15: Genetic Variation172 Questions
Exam 16: Mendelian Inheritance191 Questions
Exam 17: Inheritance of Sex Chromosomes, Linked Genes, and Organelles201 Questions
Exam 18: The Genetic and Environmental Basis of Complex Traits164 Questions
Exam 19: Genetic and Epigenetic Regulation189 Questions
Exam 20: Genes and Development201 Questions
Exam 21: Evolution: How Genotypes and Phenotypes Change Over Time182 Questions
Exam 22: Species and Speciation132 Questions
Exam 23: Evolutionary Patterns: Phylogeny and Fossils154 Questions
Exam 24: Human Origins and Evolution178 Questions
Exam 25: Cycling Carbon116 Questions
Exam 26: Bacteria and Archaea186 Questions
Exam 27: Eukaryotic Cells: Origins and Diversity153 Questions
Exam 28: Being Multicellular163 Questions
Exam 29: Plant Structure and Function: Moving Photosynthesis Onto Land179 Questions
Exam 30: Plant Reproduction: Finding Mates and Dispersing Young146 Questions
Exam 31: Plant Growth and Development187 Questions
Exam 32: Plant Defense: Keeping the World Green164 Questions
Exam 33: Plant Diversity148 Questions
Exam 34: Fungi: Structure, Function, and Diversity135 Questions
Exam 35: Animal Nervous Systems157 Questions
Exam 36: Animal Sensory Systems and Brain Function205 Questions
Exam 37: Animal Movement: Muscles and Skeletons175 Questions
Exam 38: Animal Endocrine Systems126 Questions
Exam 39: Animal Cardiovascular and Respiratory Systems153 Questions
Exam 40: Animal Metabolism, Nutrition, and Digestion172 Questions
Exam 41: Animal Renal Systems: Water and Waste150 Questions
Exam 42: Animal Reproduction and Development196 Questions
Exam 43: Animal Immune Systems169 Questions
Exam 44: Animal Diversity195 Questions
Exam 45: Animal Behavior186 Questions
Exam 46: Population Ecology132 Questions
Exam 47: Species Interactions, Communities, and Ecosystems178 Questions
Exam 48: Biomes and Global Ecology126 Questions
Exam 49: The Anthropocene: Humans As a Planetary Force192 Questions
Select questions type
The graph here shows the results of growing one strain of a crop plant in soils with different nitrogen contents.
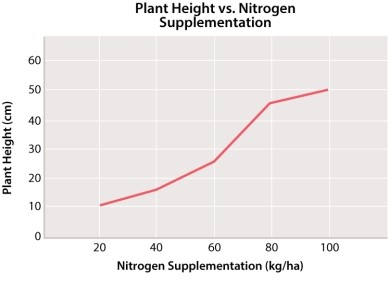 If a different strain of the same plant were grown in the same soils, you would predict that:
(Multiple Choice)
4.9/5  (43)
(43)
Name one drawback of personalized medicine, though the science behind it is sound.
(Essay)
4.8/5 (42)
In the graph of Galton's height data below, which line on the graph represents the average height of the parents in a mating? 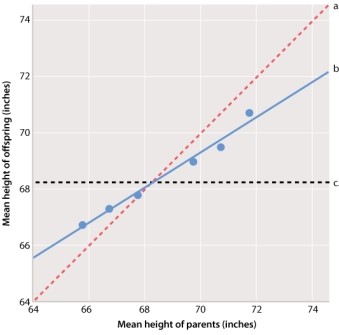
(Multiple Choice)
4.8/5 (42)
Sometimes a fertilized egg, after a few of rounds of division, separates into two embryos that results in identical, or _____, twins.
(Multiple Choice)
4.8/5 (34)
Genetic mapping of inherited risk factors that code for metabolic components of complex traits, such as genes affecting sugar metabolism in the case of type 2I diabetes, sometimes implicates different genes affecting two or more of the traits that are close together in a chromosome. This finding can be explained by:
(Multiple Choice)
4.9/5 (36)
Consider a trait determined by a rare, simple Mendelian, autosomal dominant allele. What is the concordance between identical twins? Between same-sex fraternal twins?
(Multiple Choice)
4.8/5 (38)
The plots shown here depict several possible outcomes of an experiment comparing the mean phenotype of a behavioral trait in two strains of mice in three environments. Strain 1 is represented by filled circles and Strain 2 is represented by open circles. Environment 1 (E1) is deficient in stimulation for the behavior, environment 2 (E2) has an average level of stimulation, and environment 3 (E3) is enriched in stimulation. Which of the possible results indicates the presence of genotype-by-environment interaction for one or both of the strains? 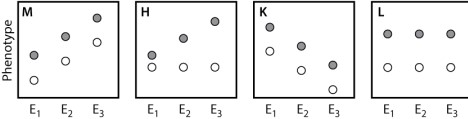
(Multiple Choice)
4.8/5 (35)
Down syndrome, the most common type of birth anomaly due to an extra chromosome, is also known as _____ 21.
(Multiple Choice)
4.8/5 (36)
Francis Galton, a contemporary of Charles Darwin, studied variation in complex traits such as human height. Use the bar graphs shown below to answer the following question: Which of the following statements BEST describes graph (a), which depicts Galton's data showing distribution of offspring height from the tallest parents he studied? 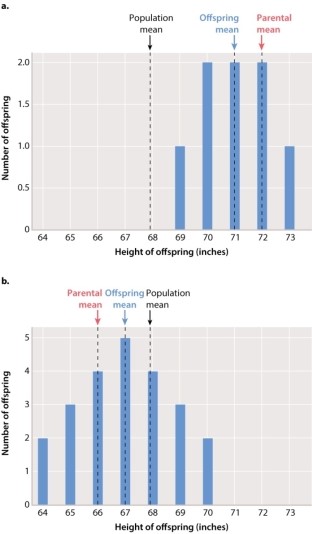
(Multiple Choice)
4.9/5 (48)
As many as two-thirds of the American population suffers from disorders determined by multiple genes and environmental factors.
(True/False)
4.7/5 (31)
The data in the table below show the concordance between identical twins and same-sex fraternal twins for five complex traits. Based on these data, which of the traits shows the GREATEST effect of heredity relative to environment? Trait Identical twin concordance (\%) Same-sex fraternal twin concordance (\%) M 100 50 H 100 75 K 100 15 L 100 100 Q 100 25
(Multiple Choice)
4.8/5 (39)
Traits that are influenced by multiple genes and the environment are called _____ traits.
(Multiple Choice)
4.9/5 (39)
Which of the following birth anomalies are complex traits?
(Multiple Choice)
5.0/5 (32)
Traits such as human height, blood pressure, and blood sugar levels can be measured along a continuum and are often called _____ traits.
(Multiple Choice)
4.9/5 (45)
Which of the traits in the accompanying table has the GREATEST heritability? Trait Population mean Parental mean Offspring mean 100 120 100 100 120 105 100 120 110 100 120 115 100 120 120
(Multiple Choice)
4.9/5 (43)
According to the graph from Figure 18.10, shown below, which complex trait shows very little influence from a genetic component? 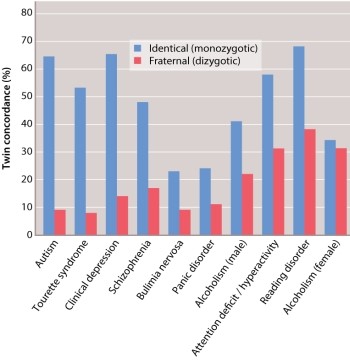
(Multiple Choice)
4.8/5 (49)
When heritability is 100%, the variation among individuals in the population is due to:
(Multiple Choice)
4.9/5 (32)
If genetically different strains of corn are grown in a greenhouse and subject to identical environmental conditions, then differences in height would be due to genetic differences and the heritability measure would:
(Multiple Choice)
4.8/5 (28)
Francis Galton, a contemporary of Charles Darwin, studied variation in complex traits such as human height. Use the bar graphs shown below to answer the following question: Which of the following statements best describes Figure 18.7 graph (b), which depicts Galton's data showing distribution of offspring height from the shortest parents he studied? 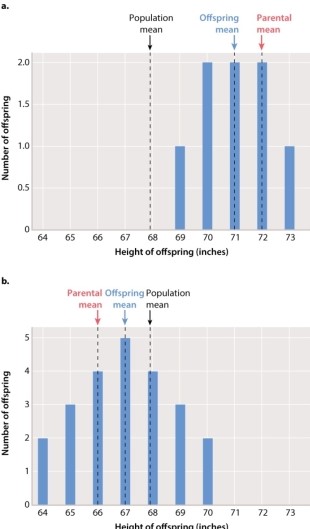
(Multiple Choice)
4.8/5 (35)
Filters
- Essay(0)
- Multiple Choice(0)
- Short Answer(0)
- True False(0)
- Matching(0)