Exam 52: An Introduction to Ecology and the Biosphere
Exam 1: Evolution, the Themes of Biology, and Scientific Inquiry51 Questions
Exam 2: The Chemical Context of Life61 Questions
Exam 3: Water and Life55 Questions
Exam 4: Carbon and the Molecular Diversity of Life58 Questions
Exam 5: The Structure and Function of Large Biological Molecules70 Questions
Exam 6: A Tour of the Cell66 Questions
Exam 7: Membrane Structure and Function68 Questions
Exam 8: An Introduction to Metabolism67 Questions
Exam 9: Cellular Respiration and Fermentation68 Questions
Exam 10: Photosynthesis65 Questions
Exam 11: Cell Communication65 Questions
Exam 12: The Cell Cycle66 Questions
Exam 13: Meiosis and Sexual Life Cycles64 Questions
Exam 14: Mendel and the Gene Idea62 Questions
Exam 15: The Chromosomal Basis of Inheritance58 Questions
Exam 16: The Molecular Basis of Inheritance65 Questions
Exam 17: Gene Expression: From Gene to Protein67 Questions
Exam 18: Regulation of Gene Expression66 Questions
Exam 19: Viruses54 Questions
Exam 20: DNA Tools and Biotechnology57 Questions
Exam 21: Genomes and Their Evolution44 Questions
Exam 22: Descent with Modification: A Darwinian View of Life60 Questions
Exam 23: The Evolution of Populations64 Questions
Exam 24: The Origin of Species67 Questions
Exam 25: The History of Life on Earth59 Questions
Exam 26: Phylogeny and the Tree of Life75 Questions
Exam 27: Bacteria and Archaea75 Questions
Exam 28: Protists79 Questions
Exam 29: Plant Diversity I: How Plants Colonized Land82 Questions
Exam 30: Plant Diversity II: The Evolution of Seed Plants80 Questions
Exam 31: Fungi75 Questions
Exam 32: An Overview of Animal Diversity67 Questions
Exam 33: An Introduction to Invertebrates83 Questions
Exam 34: The Origin and Evolution of Vertebrates82 Questions
Exam 35: Vascular Plant Structure, Growth, and Development65 Questions
Exam 36: Resource Acquisition and Transport in Vascular Plants74 Questions
Exam 37: Soil and Plant Nutrition52 Questions
Exam 38: Angiosperm Reproduction and Biotechnology60 Questions
Exam 39: Plant Responses to Internal and External Signals61 Questions
Exam 40: Basic Principles of Animal Form and Function68 Questions
Exam 41: Animal Nutrition64 Questions
Exam 42: Circulation and Gas Exchange67 Questions
Exam 43: The Immune System69 Questions
Exam 44: Osmoregulation and Excretion64 Questions
Exam 45: Hormones and the Endocrine System66 Questions
Exam 46: Animal Reproduction68 Questions
Exam 47: Animal Development70 Questions
Exam 48: Neurons, Synapses, and Signaling68 Questions
Exam 49: Nervous Systems65 Questions
Exam 50: Sensory and Motor Mechanisms67 Questions
Exam 51: Animal Behavior69 Questions
Exam 52: An Introduction to Ecology and the Biosphere68 Questions
Exam 53: Population Ecology69 Questions
Exam 54: Community Ecology71 Questions
Exam 55: Ecosystems and Restoration Ecology68 Questions
Exam 56: Conservation Biology and Global Change69 Questions
Select questions type
What would happen to the seasons if Earth were tilted 35 degrees off its orbital plane instead of the usual 23.5 degrees?
(Multiple Choice)
4.8/5  (36)
(36)
The eight climographs show yearly temperature (line graph and left vertical axis) and precipitation (bar graph and right vertical axis) averages for each month for some locations on Earth.
 What would be the primary factor, other than precipitation or temperature, that could change the description of a site near location 3 from an equatorial (tropical) climate to alpine tundra?
(Multiple Choice)
4.8/5 (32)
The eight climographs show yearly temperature (line graph and left vertical axis) and precipitation (bar graph and right vertical axis) averages for each month for some locations on Earth.
 Which climograph shows the climate for location 4?
(Multiple Choice)
4.8/5 (36)
The main reason polar regions are cooler than the equator is that ________.
(Multiple Choice)
4.8/5 (28)
Use the following figures to answer the question below.
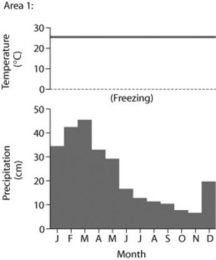
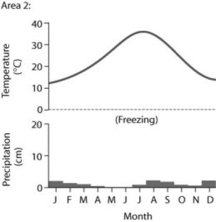 Based on the data in the figures, which of the following statements is accurate?
(Multiple Choice)
4.8/5 (37)
The eight climographs show yearly temperature (line graph and left vertical axis) and precipitation (bar graph and right vertical axis) averages for each month for some locations on Earth.
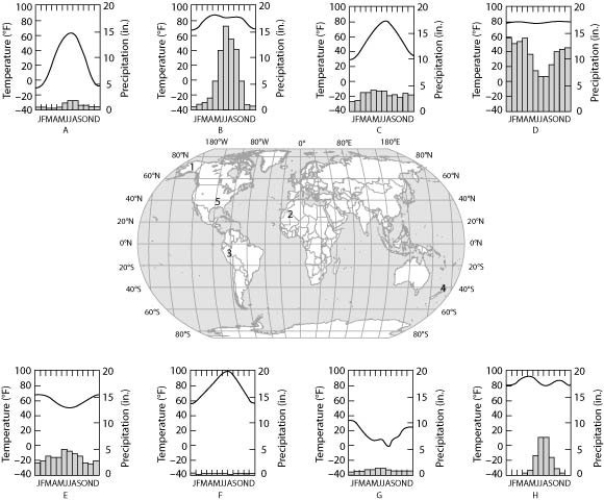 Which climograph shows the climate for location 2?
(Multiple Choice)
5.0/5 (31)
Which statements about dispersal are accurate?
I.Dispersal is a common component of the life cycles of plants and animals.
II.Colonization of devastated areas after floods or volcanic eruptions primarily depends upon climate.
III.Seeds are important dispersal stages in the life cycles of most flowering plants.
IV.Dispersal occurs only on an evolutionary time scale.
(Multiple Choice)
4.8/5 (29)
Which of the following is an important feature of most terrestrial biomes?
(Multiple Choice)
4.8/5 (38)
Filters
- Essay(0)
- Multiple Choice(0)
- Short Answer(0)
- True False(0)
- Matching(0)