Exam 12: Comparing Multiple Proportions, Test of Independence and Goodness of Fit
Exam 1: Data and Statistics98 Questions
Exam 2: Descriptive Statistics: Tabular and Graphical Displays62 Questions
Exam 3: Descriptive Statistics: Numerical Measures173 Questions
Exam 4: Introduction to Probability138 Questions
Exam 5: Discrete Probability Distributions123 Questions
Exam 6: Continuous Probability Distributions174 Questions
Exam 7: Sampling and Sampling Distributions133 Questions
Exam 8: Interval Estimation137 Questions
Exam 9: Hypothesis Tests148 Questions
Exam 10: Inference About Means and Proportions With Two Populations121 Questions
Exam 11: Inferences About Population Variances90 Questions
Exam 12: Comparing Multiple Proportions, Test of Independence and Goodness of Fit90 Questions
Exam 13: Experimental Design and Analysis of Variance115 Questions
Exam 14: Simple Linear Regression146 Questions
Exam 15: Multiple Regression115 Questions
Exam 16: Regression Analysis: Model Building76 Questions
Exam 17: Time Series Analysis and Forecasting68 Questions
Exam 18: Nonparametric Methods81 Questions
Exam 19: Statistical Methods for Quality Control29 Questions
Exam 20: Index Numbers52 Questions
Exam 21: Decision Analysis on Website65 Questions
Exam 22: Sample Survey on Website63 Questions
Select questions type
Exhibit 12-8
The following shows the number of individuals in a sample of 300 who indicated they support the new tax proposal.  We are interested in determining whether or not the opinions of the individuals of the three groups are uniformly distributed.
-Refer to Exhibit 12-8. The expected frequency for each group is
We are interested in determining whether or not the opinions of the individuals of the three groups are uniformly distributed.
-Refer to Exhibit 12-8. The expected frequency for each group is
(Multiple Choice)
5.0/5  (33)
(33)
Exhibit 12-1
When individuals in a sample of 150 were asked whether or not they supported capital punishment, the following information was obtained.  We are interested in determining whether or not the opinions of the individuals (as to Yes, No, and No Opinion) are uniformly distributed.
-Refer to Exhibit 12-1. The calculated value for the test statistic equals
We are interested in determining whether or not the opinions of the individuals (as to Yes, No, and No Opinion) are uniformly distributed.
-Refer to Exhibit 12-1. The calculated value for the test statistic equals
(Multiple Choice)
4.9/5 (29)
Two hundred fifty managers with degrees in business administration indicated their fields of concentration as shown below. 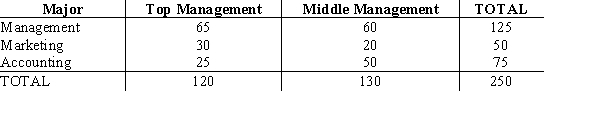 At
= .01 using the p-value approach, test to determine if the position in management is independent of the major of concentration.
At
= .01 using the p-value approach, test to determine if the position in management is independent of the major of concentration.
(Essay)
4.8/5 (35)
Exhibit 12-1
When individuals in a sample of 150 were asked whether or not they supported capital punishment, the following information was obtained. We are interested in determining whether or not the opinions of the individuals (as to Yes, No, and No Opinion) are uniformly distributed.
-Refer to Exhibit 12-1. The number of degrees of freedom associated with this problem is
(Multiple Choice)
4.8/5 (34)
Exhibit 12-3
In order to determine whether or not a particular medication was effective in curing the common cold, one group of patients was given the medication, while another group received sugar pills. The results of the study are shown below.  We are interested in determining whether or not the medication was effective in curing the common cold.
-Refer to Exhibit 12-3. The hypothesis is to be tested at the 5% level of significance. The critical value from the table equals
We are interested in determining whether or not the medication was effective in curing the common cold.
-Refer to Exhibit 12-3. The hypothesis is to be tested at the 5% level of significance. The critical value from the table equals
(Multiple Choice)
4.8/5 (35)
It is believed that sales of books at a local bookstore follow a Poisson distribution. Below you are given information on the number of books sold during a sample of 15-minute intervals.  a. What is the average number of books sold during a 15-minute period?
b. Using the Poisson distribution, find the probability associated with the number of books sold.c. Generate the expected number of books sold using a Poisson probability table.d. State the null and alternative hypotheses.
e. Calculate the test statistic.f. Use the p-value approach to test the hypotheses. What is your conclusion? Let = .05.
a. What is the average number of books sold during a 15-minute period?
b. Using the Poisson distribution, find the probability associated with the number of books sold.c. Generate the expected number of books sold using a Poisson probability table.d. State the null and alternative hypotheses.
e. Calculate the test statistic.f. Use the p-value approach to test the hypotheses. What is your conclusion? Let = .05.
(Essay)
4.7/5 (38)
From a poll of 800 television viewers, the following data have been accumulated as to their levels of education and their preference of television stations.  Test at = .05 to determine if the selection of a TV station is dependent upon the level of education. Use the p-value approach.
(Essay)
4.9/5 (36)
The following data show the grades of a sample of 40 students who have taken statistics.  Use = 0.1 and conduct a goodness of fit test to determine if the sample comes from a population that has a normal distribution. Use the critical value approach.
(Essay)
4.8/5 (26)
In order not to violate the requirements necessary to use the chi-square distribution, each expected frequency in a goodness of fit test must be
(Multiple Choice)
4.9/5 (45)
The number of emergency calls per day at a hospital over a period of 120 days is shown below. 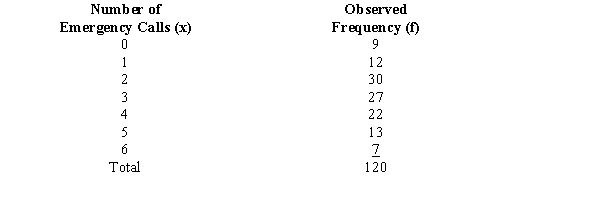 Use = 0.05 and the p-value approach to see if the above data have a Poisson distribution.
(Essay)
4.7/5 (32)
Before the rush began for Christmas shopping, a department store had noted that the percentage of its customers who use the store's credit card, the percentage of those who use a major credit card, and the percentage of those who pay cash are the same. During the Christmas rush in a sample of 150 shoppers, 46 used the store's credit card; 43 used a major credit card; and 61 paid cash. With = 0.05, test to see if the methods of payment have changed during the Christmas rush.
(Essay)
4.8/5 (27)
The following table shows the results of recent study regarding gender of individuals and their selected field of study.  We want to determine if the selected field of study is independent of gender.
a.Compute the test statistic.
b.Using the p-value approach at 90% confidence, test to see if the field of study is independent of gender.
c.Using the critical method approach at 90% confidence, test for the independence of major and gender.
We want to determine if the selected field of study is independent of gender.
a.Compute the test statistic.
b.Using the p-value approach at 90% confidence, test to see if the field of study is independent of gender.
c.Using the critical method approach at 90% confidence, test for the independence of major and gender.
(Essay)
4.7/5 (36)
Exhibit 12-5
The table below gives beverage preferences for random samples of teens and adults. 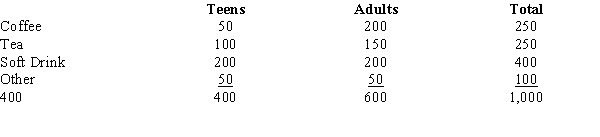 We are asked to test for independence between age (i.e., adult and teen) and drink preferences.
-Refer to Exhibit 12-5. The test statistic for this test of independence is
We are asked to test for independence between age (i.e., adult and teen) and drink preferences.
-Refer to Exhibit 12-5. The test statistic for this test of independence is
(Multiple Choice)
4.8/5 (29)
During the first few weeks of the new television season, the evening news audience proportions were recorded as ABC- 31%, CBS- 34%, and NBC- 35%. A sample of 600 homes yielded the following viewing audience data.  We want to determine whether or not there has been a significant change in the number of viewing audience of the three networks.
a.State the null and alternative hypotheses to be tested.
b.Compute the expected frequencies.
c.Compute the test statistic.
d.The null hypothesis is to be tested at 95% confidence. Determine the critical value for this test. What do you conclude?
e.Determine the p-value and perform the test.
We want to determine whether or not there has been a significant change in the number of viewing audience of the three networks.
a.State the null and alternative hypotheses to be tested.
b.Compute the expected frequencies.
c.Compute the test statistic.
d.The null hypothesis is to be tested at 95% confidence. Determine the critical value for this test. What do you conclude?
e.Determine the p-value and perform the test.
(Essay)
4.8/5 (32)
The degrees of freedom for a contingency table with 6 rows and 3 columns is
(Multiple Choice)
4.8/5 (37)
The degrees of freedom for a contingency table with 10 rows and 11 columns is
(Multiple Choice)
4.9/5 (38)
Exhibit 12-7
You want to test whether or not the following sample of 30 observations follows a normal distribution. The mean of the sample equals 11.83, and the standard deviation equals 4.53. 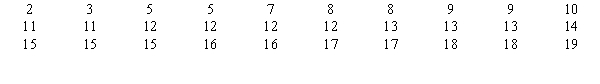 -Refer to Exhibit 12-7. The p-value is
(Multiple Choice)
4.9/5 (30)
The makers of Compute-All know that in the past, 40% of their sales were from people under 30 years old, 45% of their sales were from people who are between 30 and 50 years old, and 15% of their sales were from people who are over 50 years old. A sample of 300 customers was taken to see if the market shares had changed. In the sample, 100 of the people were under 30 years old, 150 people were between 30 and 50 years old, and 50 people were over 50 years old.
a.State the null and alternative hypotheses to be tested.
b.Compute the test statistic.
c.The null hypothesis is to be tested at the 1% level of significance. Determine the critical value from the table.
d.What do you conclude?
(Essay)
4.7/5 (42)
The personnel department of a large corporation reported sixty resignations during the last year. The following table groups these resignations according to the season in which they occurred:  Test to see if the number of resignations is uniform over the four seasons.
Let = 0.05.
Test to see if the number of resignations is uniform over the four seasons.
Let = 0.05.
(Essay)
4.9/5 (27)
Filters
- Essay(0)
- Multiple Choice(0)
- Short Answer(0)
- True False(0)
- Matching(0)