Exam 12: Comparing Multiple Proportions, Test of Independence and Goodness of Fit
Exam 1: Data and Statistics98 Questions
Exam 2: Descriptive Statistics: Tabular and Graphical Displays62 Questions
Exam 3: Descriptive Statistics: Numerical Measures173 Questions
Exam 4: Introduction to Probability138 Questions
Exam 5: Discrete Probability Distributions123 Questions
Exam 6: Continuous Probability Distributions174 Questions
Exam 7: Sampling and Sampling Distributions133 Questions
Exam 8: Interval Estimation137 Questions
Exam 9: Hypothesis Tests148 Questions
Exam 10: Inference About Means and Proportions With Two Populations121 Questions
Exam 11: Inferences About Population Variances90 Questions
Exam 12: Comparing Multiple Proportions, Test of Independence and Goodness of Fit90 Questions
Exam 13: Experimental Design and Analysis of Variance115 Questions
Exam 14: Simple Linear Regression146 Questions
Exam 15: Multiple Regression115 Questions
Exam 16: Regression Analysis: Model Building76 Questions
Exam 17: Time Series Analysis and Forecasting68 Questions
Exam 18: Nonparametric Methods81 Questions
Exam 19: Statistical Methods for Quality Control29 Questions
Exam 20: Index Numbers52 Questions
Exam 21: Decision Analysis on Website65 Questions
Exam 22: Sample Survey on Website63 Questions
Select questions type
A statistical test conducted to determine whether to reject or not reject a hypothesized probability distribution for a population is known as a
(Multiple Choice)
5.0/5  (32)
(32)
Shown below is 2 x 3 contingency table with observed values from a sample of 500. At 95% confidence using the critical value approach, test for independence of the row and column factors. 
(Essay)
4.8/5 (41)
The number of degrees of freedom for the appropriate chi-square distribution in a test of independence is
(Multiple Choice)
4.7/5 (22)
A sample of 150 individuals (males and females) was surveyed, and the individuals were asked to indicate their yearly incomes. Their incomes were categorized as follows.  The results of the survey are shown below.
  We want to determine if yearly income is independent of gender.
a.Compute the test statistic.
b.Using the p-value approach, test to determine if yearly income is independent of gender.
We want to determine if yearly income is independent of gender.
a.Compute the test statistic.
b.Using the p-value approach, test to determine if yearly income is independent of gender.
(Essay)
4.9/5 (37)
Shoppers were asked where they do their regular grocery shopping. The table below shows the responses of the sampled shoppers. We are interested in determining if the proportions of females in the three categories are different from each other. 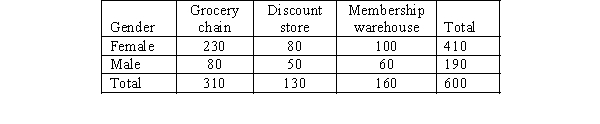 a.Provide the null and the alternative hypotheses.
b.Determine the expected frequencies.
c.Compute the sample proportions.
d.Compute the critical values (CVij).
e.Give your conclusions by providing numerical reasoning.
a.Provide the null and the alternative hypotheses.
b.Determine the expected frequencies.
c.Compute the sample proportions.
d.Compute the critical values (CVij).
e.Give your conclusions by providing numerical reasoning.
(Essay)
4.8/5 (39)
The results of a recent study regarding smoking and three types of illness are shown in the following table. 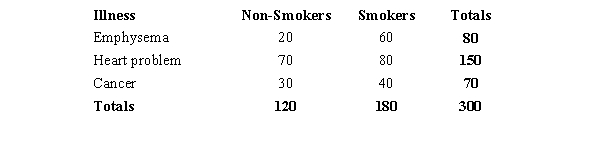 We are interested in determining whether or not illness is independent of smoking.
a.State the null and alternative hypotheses to be tested.
b.Show the contingency table of the expected frequencies.
c.Compute the test statistic.
d.The null hypothesis is to be tested at 95% confidence. Determine the critical value for this test. What do you conclude?
e.Determine the p-value and perform the test.
We are interested in determining whether or not illness is independent of smoking.
a.State the null and alternative hypotheses to be tested.
b.Show the contingency table of the expected frequencies.
c.Compute the test statistic.
d.The null hypothesis is to be tested at 95% confidence. Determine the critical value for this test. What do you conclude?
e.Determine the p-value and perform the test.
(Essay)
4.7/5 (41)
In the last presidential election, before the candidates started their major campaigns, the percentages of registered voters who favored the various candidates were as follows.  After the major campaigns began, a random sample of 400 voters showed that 172 favored the Republican candidate; 164 were in favor of the Democratic candidate; and 64 favored the Independent candidate. We are interested in determining whether the proportion of voters who favored the various candidates had changed.
a.Compute the test statistic.
b.Using the p-value approach, test to see if the proportions have changed.
c.Using the critical value approach, test the hypotheses.
After the major campaigns began, a random sample of 400 voters showed that 172 favored the Republican candidate; 164 were in favor of the Democratic candidate; and 64 favored the Independent candidate. We are interested in determining whether the proportion of voters who favored the various candidates had changed.
a.Compute the test statistic.
b.Using the p-value approach, test to see if the proportions have changed.
c.Using the critical value approach, test the hypotheses.
(Essay)
4.8/5 (31)
An insurance company has gathered the following information regarding the number of accidents reported per day over a period of 100 days. 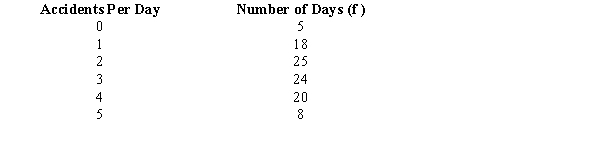 Using the critical value approach test to see if the above data have a Poisson distribution. Let = 0.05.
(Essay)
4.7/5 (39)
Five hundred randomly selected automobile owners were questioned on the main reason they had purchased their current automobile. The results are given below. 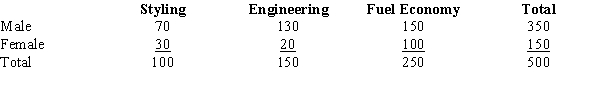 a.State the null and alternative hypotheses for a contingency table test.
b.State the decision rule for the critical value approach. Let = .01.
c.Calculate the 2 test statistic.
d.Give your conclusion for this test.
a.State the null and alternative hypotheses for a contingency table test.
b.State the decision rule for the critical value approach. Let = .01.
c.Calculate the 2 test statistic.
d.Give your conclusion for this test.
(Essay)
4.8/5 (33)
Filters
- Essay(0)
- Multiple Choice(0)
- Short Answer(0)
- True False(0)
- Matching(0)