Exam 3: Descriptive Statistics: Numerical Measures
Exam 1: Data and Statistics98 Questions
Exam 2: Descriptive Statistics: Tabular and Graphical Displays62 Questions
Exam 3: Descriptive Statistics: Numerical Measures173 Questions
Exam 4: Introduction to Probability138 Questions
Exam 5: Discrete Probability Distributions123 Questions
Exam 6: Continuous Probability Distributions174 Questions
Exam 7: Sampling and Sampling Distributions133 Questions
Exam 8: Interval Estimation137 Questions
Exam 9: Hypothesis Tests148 Questions
Exam 10: Inference About Means and Proportions With Two Populations121 Questions
Exam 11: Inferences About Population Variances90 Questions
Exam 12: Comparing Multiple Proportions, Test of Independence and Goodness of Fit90 Questions
Exam 13: Experimental Design and Analysis of Variance115 Questions
Exam 14: Simple Linear Regression146 Questions
Exam 15: Multiple Regression115 Questions
Exam 16: Regression Analysis: Model Building76 Questions
Exam 17: Time Series Analysis and Forecasting68 Questions
Exam 18: Nonparametric Methods81 Questions
Exam 19: Statistical Methods for Quality Control29 Questions
Exam 20: Index Numbers52 Questions
Exam 21: Decision Analysis on Website65 Questions
Exam 22: Sample Survey on Website63 Questions
Select questions type
Exhibit 3-3
A researcher has collected the following sample data. The mean of the sample is 5.
3 5 12 3 2
-Refer to Exhibit 3-3. The range is
(Multiple Choice)
4.9/5  (38)
(38)
The measure of location which is the most likely to be influenced by extreme values in the data set is the
(Multiple Choice)
4.7/5 (29)
Since the population size is always larger than the sample size, then the sample statistic
(Multiple Choice)
4.9/5 (28)
The population change between 2000 and 2010 for several small cities are shown below. 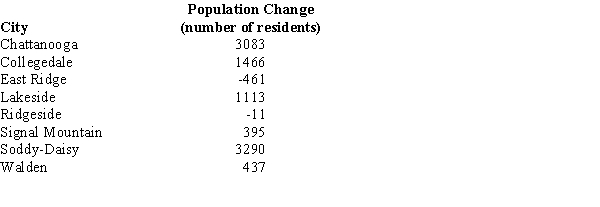 For the above sample, determine the following measures.
a.The mean
b.The standard deviation
c.The median
For the above sample, determine the following measures.
a.The mean
b.The standard deviation
c.The median
(Short Answer)
4.9/5 (33)
The yearly incomes of the top highest paying professions in the United States are shown below. 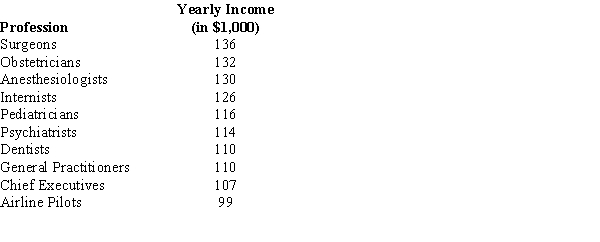 For the above sample, determine the following measures (Give your answer in dollars).
a.The mean yearly salary
b.The standard deviation
c.The median
d.The mode
For the above sample, determine the following measures (Give your answer in dollars).
a.The mean yearly salary
b.The standard deviation
c.The median
d.The mode
(Short Answer)
4.8/5 (37)
Exhibit 3-4
The following is the frequency distribution for the speeds of a sample of automobiles traveling on an interstate highway. 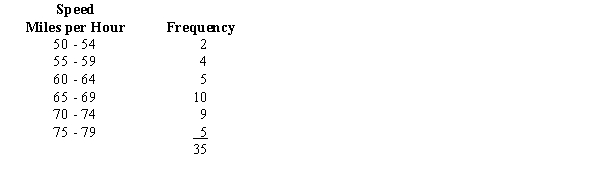 -Refer to Exhibit 3-4. The mean is
(Multiple Choice)
4.9/5 (42)
The variance of a sample was reported to be 144. The report indicated that  = 7200. What has been the sample size?
(Multiple Choice)
4.8/5 (35)
The sum of deviations of the individual data elements from their mean is
(Multiple Choice)
4.8/5 (43)
The following data shows the number of students enrolled in various professors' statistics classes.  For the above sample, compute the following measures.
a.The variance
b.The standard deviation
c.If we consider professor A's enrollment as an outlier, compute the variance and the standard deviations, excluding Professor A's class. (Round to the nearest hundredth, as needed.)
For the above sample, compute the following measures.
a.The variance
b.The standard deviation
c.If we consider professor A's enrollment as an outlier, compute the variance and the standard deviations, excluding Professor A's class. (Round to the nearest hundredth, as needed.)
(Short Answer)
4.8/5 (38)
The grade point average of the students at UTC is 2.80 with a standard deviation of 0.84. The grade point average of students at UTK is 2.4 with a standard deviation of 0.84. Which university shows a more dispersed grade distribution?
(Essay)
4.9/5 (39)
Filters
- Essay(0)
- Multiple Choice(0)
- Short Answer(0)
- True False(0)
- Matching(0)