Exam 3: Descriptive Statistics: Numerical Measures
Exam 1: Data and Statistics98 Questions
Exam 2: Descriptive Statistics: Tabular and Graphical Displays62 Questions
Exam 3: Descriptive Statistics: Numerical Measures173 Questions
Exam 4: Introduction to Probability138 Questions
Exam 5: Discrete Probability Distributions123 Questions
Exam 6: Continuous Probability Distributions174 Questions
Exam 7: Sampling and Sampling Distributions133 Questions
Exam 8: Interval Estimation137 Questions
Exam 9: Hypothesis Tests148 Questions
Exam 10: Inference About Means and Proportions With Two Populations121 Questions
Exam 11: Inferences About Population Variances90 Questions
Exam 12: Comparing Multiple Proportions, Test of Independence and Goodness of Fit90 Questions
Exam 13: Experimental Design and Analysis of Variance115 Questions
Exam 14: Simple Linear Regression146 Questions
Exam 15: Multiple Regression115 Questions
Exam 16: Regression Analysis: Model Building76 Questions
Exam 17: Time Series Analysis and Forecasting68 Questions
Exam 18: Nonparametric Methods81 Questions
Exam 19: Statistical Methods for Quality Control29 Questions
Exam 20: Index Numbers52 Questions
Exam 21: Decision Analysis on Website65 Questions
Exam 22: Sample Survey on Website63 Questions
Select questions type
A sample of charge accounts at a local drug store revealed the following frequency distribution of unpaid balances. 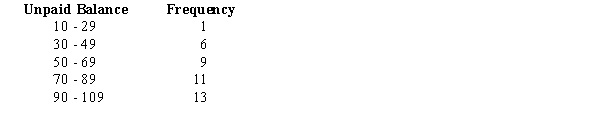 a.Determine the mean unpaid balance.
b.Determine the variance.
c.Determine the standard deviation.
d.Compute the coefficient of variation.
a.Determine the mean unpaid balance.
b.Determine the variance.
c.Determine the standard deviation.
d.Compute the coefficient of variation.
(Short Answer)
4.8/5  (32)
(32)
For the following frequency distribution, 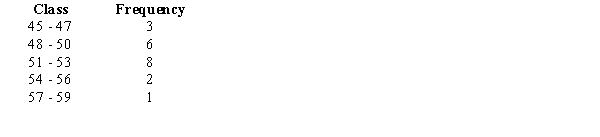 a.Compute the mean.
b.Compute the standard deviation. (Assume the data represent a population.)
a.Compute the mean.
b.Compute the standard deviation. (Assume the data represent a population.)
(Short Answer)
4.9/5 (34)
In a statistics class, the average grade on the final examination was 75 with a standard deviation of 5. Use Chebyshev's theorem to answer the following questions.
a.At least what percentage of the students received grades between 50 and 100?
b.Determine an interval for the grades that will be true for at least 70% of the students. (Hint: First, compute the Z-score.)
(Essay)
4.9/5 (42)
The following data show the yearly salaries of a sample of MBA graduates. 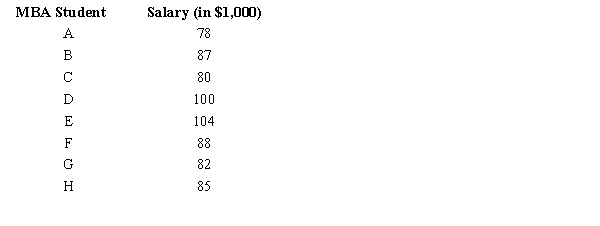 a.Compute the mean yearly salary and give your answer in dollars.
b.Compute the standard deviation and give your answer in dollars.
c.Compute the 75th percentile and give your answer in dollars. Fully explain what the value that you have determined indicates.
a.Compute the mean yearly salary and give your answer in dollars.
b.Compute the standard deviation and give your answer in dollars.
c.Compute the 75th percentile and give your answer in dollars. Fully explain what the value that you have determined indicates.
(Essay)
4.9/5 (38)
Exhibit 3-1
The following data show the number of hours worked by 200 statistics students. 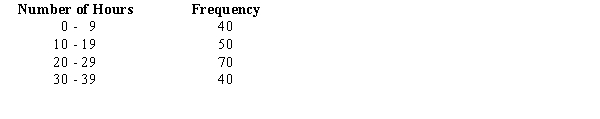 -Refer to Exhibit 3-1. The number of students working 19 hours or less
(Multiple Choice)
4.8/5 (27)
The weights (in pounds) of a sample of 36 individuals were recorded and the following statistics were calculated.mean = 160 range = 60
Mode = 165
Variance = 324
Median = 170
The coefficient of variation equals
(Multiple Choice)
4.8/5 (33)
Which of the following symbols represents the size of the population?
(Multiple Choice)
4.8/5 (28)
The following data show the yearly salaries of a random sample of Chattanooga residents. 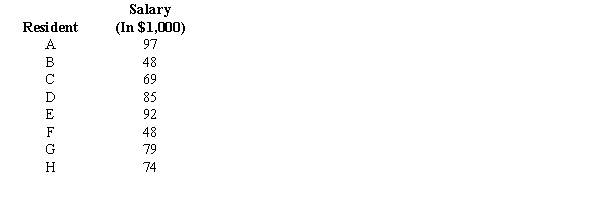 For the above sample, determine the following measures (Give your answer in dollars):
a.The mean yearly salary.
b.The standard deviation.
c.The mode.
d.The median.
e.The 70th percentile
For the above sample, determine the following measures (Give your answer in dollars):
a.The mean yearly salary.
b.The standard deviation.
c.The mode.
d.The median.
e.The 70th percentile
(Essay)
4.9/5 (35)
Exhibit 3-2
A researcher has collected the following sample data
5 12 6 8 5
6 7 5 12 4
-Refer to Exhibit 3-2. The mean is
(Multiple Choice)
4.9/5 (28)
Descriptive statistics for the closing stock prices of two companies for several trading periods are shown below. 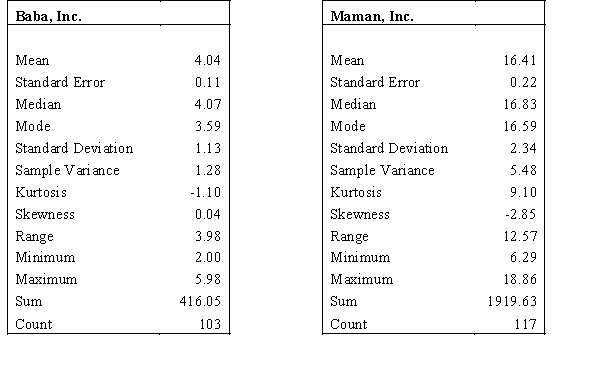 a.Which company's stock price has a more dispersed distribution? Explain. Show your complete work and support your answer.
b.Compare the Skewness of the two and explain what is indicated.
a.Which company's stock price has a more dispersed distribution? Explain. Show your complete work and support your answer.
b.Compare the Skewness of the two and explain what is indicated.
(Essay)
5.0/5 (43)
Exhibit 3-5
You are given the following frequency distribution. 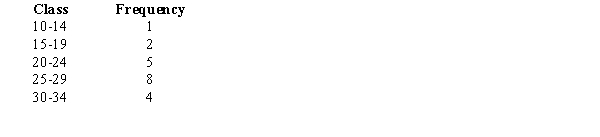 -Refer to Exhibit 3-5. The standard deviation is
(Multiple Choice)
4.7/5 (36)
The hourly wages of a sample of 130 system analysts are given below. mean = 60
Range = 20
Mode = 73
Variance = 324
Median = 74
The coefficient of variation equals
(Multiple Choice)
4.8/5 (34)
Exhibit 3-1
The following data show the number of hours worked by 200 statistics students.
-Refer to Exhibit 3-1. The cumulative relative frequency for the class of 10 - 19
(Multiple Choice)
4.8/5 (31)
Which of the following symbols represents the standard deviation of the population?
(Multiple Choice)
4.9/5 (33)
Exhibit 3-2
A researcher has collected the following sample data
5 12 6 8 5
6 7 5 12 4
-Refer to Exhibit 3-2. The 75th percentile is
(Multiple Choice)
4.8/5 (38)
Filters
- Essay(0)
- Multiple Choice(0)
- Short Answer(0)
- True False(0)
- Matching(0)