Exam 3: Descriptive Statistics: Numerical Measures
Exam 1: Data and Statistics98 Questions
Exam 2: Descriptive Statistics: Tabular and Graphical Displays62 Questions
Exam 3: Descriptive Statistics: Numerical Measures173 Questions
Exam 4: Introduction to Probability138 Questions
Exam 5: Discrete Probability Distributions123 Questions
Exam 6: Continuous Probability Distributions174 Questions
Exam 7: Sampling and Sampling Distributions133 Questions
Exam 8: Interval Estimation137 Questions
Exam 9: Hypothesis Tests148 Questions
Exam 10: Inference About Means and Proportions With Two Populations121 Questions
Exam 11: Inferences About Population Variances90 Questions
Exam 12: Comparing Multiple Proportions, Test of Independence and Goodness of Fit90 Questions
Exam 13: Experimental Design and Analysis of Variance115 Questions
Exam 14: Simple Linear Regression146 Questions
Exam 15: Multiple Regression115 Questions
Exam 16: Regression Analysis: Model Building76 Questions
Exam 17: Time Series Analysis and Forecasting68 Questions
Exam 18: Nonparametric Methods81 Questions
Exam 19: Statistical Methods for Quality Control29 Questions
Exam 20: Index Numbers52 Questions
Exam 21: Decision Analysis on Website65 Questions
Exam 22: Sample Survey on Website63 Questions
Select questions type
The following data show the yearly salaries of football coaches at some state supported universities.  For the above sample, determine the following measures.
a.The mean yearly salary
b.The standard deviation
c.The mode
d.The median
e.The 70th percentile
For the above sample, determine the following measures.
a.The mean yearly salary
b.The standard deviation
c.The mode
d.The median
e.The 70th percentile
(Short Answer)
4.7/5  (19)
(19)
Given the following information: Standard deviation = 8
Coefficient of variation = 64%
The mean would then be
(Multiple Choice)
4.8/5 (30)
The variance of a sample of 81 observations equals 64. The standard deviation of the sample equals
(Multiple Choice)
4.7/5 (25)
A numerical value used as a summary measure for a sample, such as sample mean, is known as a
(Multiple Choice)
4.9/5 (35)
The difference between the largest and the smallest data values is the
(Multiple Choice)
4.8/5 (28)
If the coefficient of variation is 40% and the mean is 70, then the variance is
(Multiple Choice)
4.9/5 (35)
The average wage of Tennessee cashiers is $14 per hour with a standard deviation of $4.20. In Georgia, the average wage of cashiers is $16 with a standard deviation of $4.40. In which state do the wages of cashiers appear to be more dispersed?
(Essay)
4.8/5 (32)
The table below shows the population growth rate of a city for the years 2008 through 2012. 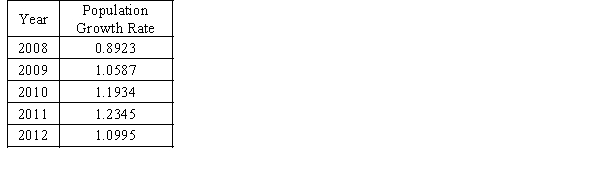 a.Compute the geometric mean.
b.What has been the percentage growth in the population of the city between 2009 to 2012?
a.Compute the geometric mean.
b.What has been the percentage growth in the population of the city between 2009 to 2012?
(Short Answer)
4.8/5 (35)
The following frequency distribution shows the yearly tuition (in $1,000s) of a sample of private colleges. 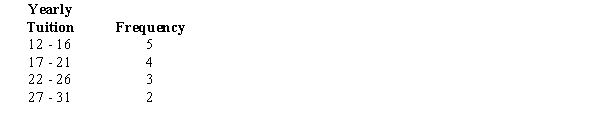 For the above data, compute the mean yearly tuition. (Give your answer in dollars.)
(Short Answer)
4.8/5 (41)
In computing the mean of a sample, the value of xi is divided by
(Multiple Choice)
4.7/5 (30)
Below is a sample of scores from a professor's most recent exam.  Calculate the following.
a.The mean
b.The standard deviation
c.The 65th percentile (Round to the nearest hundredth, as needed.)
Calculate the following.
a.The mean
b.The standard deviation
c.The 65th percentile (Round to the nearest hundredth, as needed.)
(Short Answer)
4.8/5 (34)
The following frequency distribution shows the ACT scores of a sample of students:  For the above data, compute the following.
a.The mean
b.The standard deviation
For the above data, compute the following.
a.The mean
b.The standard deviation
(Short Answer)
4.8/5 (46)
During a cold winter, the temperature stayed below zero for ten days (ranging from -20 to -5). The variance of the temperatures of the ten-day period
(Multiple Choice)
4.8/5 (29)
Exhibit 3-6
The closing stock price of MNM Corporation for the last 7 trading days is shown below.  -Refer to Exhibit 3-6. The median is
(Multiple Choice)
4.8/5 (29)
Since the population is always larger than the sample, the value of the sample mean
(Multiple Choice)
4.8/5 (35)
From a population of size 500, a random sample of 50 items is selected. The mode of the sample
(Multiple Choice)
4.9/5 (33)
Filters
- Essay(0)
- Multiple Choice(0)
- Short Answer(0)
- True False(0)
- Matching(0)