Exam 3: Quality and Performance
Exam 1: Using Operations to Create Value115 Questions
Exam 2: Process Strategy and Analysis239 Questions
Exam 3: Quality and Performance198 Questions
Exam 4: Capacity Planning120 Questions
Exam 5: Constraint Management136 Questions
Exam 6: Lean Systems166 Questions
Exam 7: Project Management139 Questions
Exam 8: Forecasting150 Questions
Exam 9: Inventory Management205 Questions
Exam 10: Operations Planning and Scheduling149 Questions
Exam 11: Resource Planning124 Questions
Exam 12: Supply Chain Design77 Questions
Exam 13: Supply Chain Logistic Networks114 Questions
Exam 14: Supply Chain Integration120 Questions
Exam 15: Supply Chain Sustainability78 Questions
Exam 16: Supplement A Decision Making107 Questions
Exam 17: Supplement J Operations Scheduling123 Questions
Exam 18: Supplement K Layout39 Questions
Exam 19: Supplement B Waiting Lines111 Questions
Exam 20: Supplement C Special Inventory Models53 Questions
Exam 21: Supplement D Linear Programming87 Questions
Exam 22: Supplement E Simulation54 Questions
Exam 23: Supplement F Financial Analysis55 Questions
Exam 24: Supplement G Acceptance Sampling Plans87 Questions
Exam 25: Supplement H Measuring Output Rates108 Questions
Exam 26: Supplement I Learning Curve Analysis50 Questions
Select questions type
Hassan was the company plotter. Give him any data set and he could plot a graph that was not only accurate, but also aesthetically pleasing. One afternoon he took some attribute data and plotted it as a p-chart. When Saba, his supervisor, saw the plot he insisted it be discarded and in its place a c-chart should be constructed. Hassan made the c-chart and noticed that when he placed the two charts one on top of the other, the lines created by the data points were exactly the same shape. Has our plotting colleague made a mistake? If not, why should there be these two types of charts when the data generate identical lines?
(Essay)
4.7/5  (40)
(40)
Historically, the average proportion of defective bars has been 0.015. Samples will be of 100 bars each. Construct a p-chart using z = 3. What is the value of UCL?
(Multiple Choice)
4.9/5 (39)
Internal customers are those that have some familial relation working at the business providing the good or service.
(True/False)
4.7/5 (43)
________ is an approach to teamwork that moves responsibility for decisions farther down the organizational chart-to the level of the employee actually doing the job.
(Short Answer)
4.7/5 (37)
In acceptance sampling, when the random sample passes the buyer's incoming test (low number of defects found), the next action taken is to:
(Multiple Choice)
4.9/5 (36)
A company is interested in monitoring the number of scratches on Plexiglass panels. The appropriate control chart to use would be:
(Multiple Choice)
4.8/5 (38)
While acceptance sampling does determine if incoming materials should be accepted or rejected, it does not limit the buyer's risk of accepting bad-quality parts or rejecting good-quality parts.
(True/False)
4.9/5 (31)
The poultry farmer was aghast when the grocery store revealed their new weapon in the war on poor quality. They planned to use a(n) ________ to monitor the rotten eggs found in the cartons of farm fresh free range eggs that he supplied. The poultry farmer was well-versed in quality and knew their choice to be the right one; nevertheless he was upset about this level of scrutiny and what he perceived as a lack of trust.
(Short Answer)
4.7/5 (36)
Use the data in Table 5.4. What would be the best chart to construct to monitor how consistent the production process is?
(Multiple Choice)
4.9/5 (33)
The upper and lower specification limits for a component are 3.98 and 4.02 inches, respectively. The process standard deviation is .004, and the process average is 4.005 inches. Is this process capable of achieving four-sigma performance (the four-sigma performance target value is 1.33)?
(Essay)
4.9/5 (26)
Table 5.11
Factors for Calculating Three-Sigma Limits for the
Chart and R-Chart
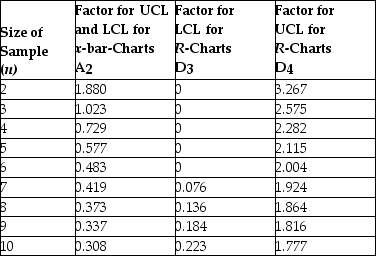 Source: 1950 ASTM Manual on Quality Control of Materials, copyright American Society for Testing Materials. Reprinted with permission.
-Thermostats are subjected to rigorous testing before they are shipped to air conditioning technicians around the world. Results from the last five samples are shown in the table. Create control charts that will fully monitor the process and indicate the result of X-bar and R-chart analysis.
Source: 1950 ASTM Manual on Quality Control of Materials, copyright American Society for Testing Materials. Reprinted with permission.
-Thermostats are subjected to rigorous testing before they are shipped to air conditioning technicians around the world. Results from the last five samples are shown in the table. Create control charts that will fully monitor the process and indicate the result of X-bar and R-chart analysis. 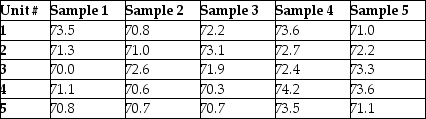
(Multiple Choice)
4.9/5 (39)
________ of variation are the purely random, unidentifiable sources of variation that are unavoidable with the current process.
(Short Answer)
4.8/5 (31)
Among the seven criteria in the Baldrige Performance Excellence Program, which has the greatest weight in scoring?
(Multiple Choice)
4.9/5 (35)
When considering the plan-do-study-act cycle for problem solving, quantitative goals are set for process improvement in the ________ step.
(Multiple Choice)
4.8/5 (33)
What is the difference between the Cp and Cpk measures? Provide an example of a situation in which a process might perform well on one measure but poorly on the other.
(Essay)
4.9/5 (42)
Filters
- Essay(0)
- Multiple Choice(0)
- Short Answer(0)
- True False(0)
- Matching(0)