Exam 3: Quality and Performance
Exam 1: Using Operations to Create Value115 Questions
Exam 2: Process Strategy and Analysis239 Questions
Exam 3: Quality and Performance198 Questions
Exam 4: Capacity Planning120 Questions
Exam 5: Constraint Management136 Questions
Exam 6: Lean Systems166 Questions
Exam 7: Project Management139 Questions
Exam 8: Forecasting150 Questions
Exam 9: Inventory Management205 Questions
Exam 10: Operations Planning and Scheduling149 Questions
Exam 11: Resource Planning124 Questions
Exam 12: Supply Chain Design77 Questions
Exam 13: Supply Chain Logistic Networks114 Questions
Exam 14: Supply Chain Integration120 Questions
Exam 15: Supply Chain Sustainability78 Questions
Exam 16: Supplement A Decision Making107 Questions
Exam 17: Supplement J Operations Scheduling123 Questions
Exam 18: Supplement K Layout39 Questions
Exam 19: Supplement B Waiting Lines111 Questions
Exam 20: Supplement C Special Inventory Models53 Questions
Exam 21: Supplement D Linear Programming87 Questions
Exam 22: Supplement E Simulation54 Questions
Exam 23: Supplement F Financial Analysis55 Questions
Exam 24: Supplement G Acceptance Sampling Plans87 Questions
Exam 25: Supplement H Measuring Output Rates108 Questions
Exam 26: Supplement I Learning Curve Analysis50 Questions
Select questions type
Table 5.11
Factors for Calculating Three-Sigma Limits for the
Chart and R-Chart
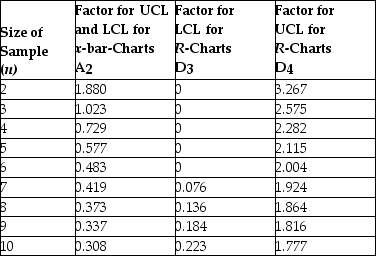 Source: 1950 ASTM Manual on Quality Control of Materials, copyright American Society for Testing Materials. Reprinted with permission.
-Construct a 3-sigma x-bar chart for the length in centimeters of a part from the following table. What is the upper control limit?
Source: 1950 ASTM Manual on Quality Control of Materials, copyright American Society for Testing Materials. Reprinted with permission.
-Construct a 3-sigma x-bar chart for the length in centimeters of a part from the following table. What is the upper control limit? 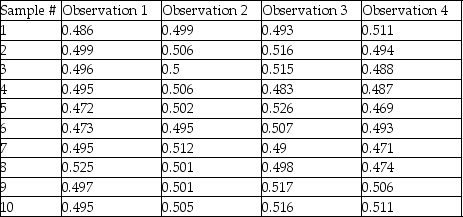
(Multiple Choice)
4.8/5  (36)
(36)
An acceptable quality level is measured as the proportion of defective items a buyer is willing to tolerate.
(True/False)
4.8/5 (41)
Which one of the following statements is a key feature of both TQM and Six Sigma?
(Multiple Choice)
4.7/5 (41)
From an ethical standpoint, it is not a requirement to consider the greater societal effects of decisions that reduce the costs of quality.
(True/False)
4.7/5 (37)
On a control chart, a type I error occurs when the employee concludes that the process is in control when it is actually out of statistical control.
(True/False)
4.9/5 (30)
As he entered his broker's office for the first time, the young associate professor was dazzled by its tasteful accoutrements and the offer of a double tall, split shot, skinny, hazelnut latte. He knew his lottery winnings would be safe here, thanks to his:
(Multiple Choice)
4.8/5 (35)
The ________ section of the Baldrige Performance Excellence Program has the greatest emphasis.
(Short Answer)
4.8/5 (35)
Financial and market results are one consideration of the Baldrige Performance Excellence Program.
(True/False)
4.9/5 (46)
Historically, the average proportion of defective bars has been 0.015. Samples will be of 100 bars each. Construct a p-chart using z = 3. What is the value of LCL?
(Multiple Choice)
4.7/5 (38)
Since an employee's responsibility is to move production along, it is ethical to knowingly pass defective services or products to internal or external customers when capacity is tight.
(True/False)
4.9/5 (41)
MKS Inc., produces meter sticks that have a target length of 100 centimeters with upper and lower specification limits of 100.05 and 99.95 centimeters respectively. Their existing process produces meter sticks with an average length of 99.97 centimeters and a standard deviation of 0.015 centimeters. What is their process capability index?
(Multiple Choice)
4.8/5 (46)
Training employees on how to utilize a statistical quality tool would be an example of the intersection between employee involvement and analytical process thinking.
(True/False)
4.9/5 (44)
________ of variation include any variation-causing factors that can be identified and eliminated.
(Short Answer)
4.7/5 (38)
A hotel tracks the number of complaints per month. When the process is in control, there is an average of 35 complaints per month. Assume that a 2-sigma control limit is used. What is the lower control limit?
(Multiple Choice)
4.7/5 (42)
Regarding control charts, changing from three-sigma limits to two-sigma limits:
(Multiple Choice)
4.8/5 (31)
The process and R-charts are developed using a sample size of 5, but the technician mistakenly looks up A2, D3, and D4 values for a sample size of 7. If these charts are put into daily use, the manufacturer will mistakenly ship more bad product than had the charts been constructed correctly.
(True/False)
4.9/5 (34)
The defect rate for a product has historically been about 2.0%. What are the upper and lower control chart limits if you wish to use a sample size of 100 and 3-sigma limits? All answers are in (LCL,UCL) format.
(Multiple Choice)
4.9/5 (28)
Which step of the Six Sigma DMAIC procedure monitors the process to make sure high performance levels are maintained?
(Multiple Choice)
4.8/5 (30)
The consultant suspiciously eyed the c-chart that Chickenverks used to monitor the number of broken eggs in each 100 egg carton. "You know you really should be using a p-chart," the consultant commented with an air of superiority. "What's the difference between a p-chart and a c-chart in this application?" the long time Chickenverks employee asked with an obvious edge to his voice. "Well," the consultant replied, "the difference is:
(Multiple Choice)
5.0/5 (37)
Filters
- Essay(0)
- Multiple Choice(0)
- Short Answer(0)
- True False(0)
- Matching(0)