Exam 3: Quality and Performance
Exam 1: Using Operations to Create Value115 Questions
Exam 2: Process Strategy and Analysis239 Questions
Exam 3: Quality and Performance198 Questions
Exam 4: Capacity Planning120 Questions
Exam 5: Constraint Management136 Questions
Exam 6: Lean Systems166 Questions
Exam 7: Project Management139 Questions
Exam 8: Forecasting150 Questions
Exam 9: Inventory Management205 Questions
Exam 10: Operations Planning and Scheduling149 Questions
Exam 11: Resource Planning124 Questions
Exam 12: Supply Chain Design77 Questions
Exam 13: Supply Chain Logistic Networks114 Questions
Exam 14: Supply Chain Integration120 Questions
Exam 15: Supply Chain Sustainability78 Questions
Exam 16: Supplement A Decision Making107 Questions
Exam 17: Supplement J Operations Scheduling123 Questions
Exam 18: Supplement K Layout39 Questions
Exam 19: Supplement B Waiting Lines111 Questions
Exam 20: Supplement C Special Inventory Models53 Questions
Exam 21: Supplement D Linear Programming87 Questions
Exam 22: Supplement E Simulation54 Questions
Exam 23: Supplement F Financial Analysis55 Questions
Exam 24: Supplement G Acceptance Sampling Plans87 Questions
Exam 25: Supplement H Measuring Output Rates108 Questions
Exam 26: Supplement I Learning Curve Analysis50 Questions
Select questions type
Which of these ISO standards has the greatest number of organizations certified as of 2009?
(Multiple Choice)
4.8/5  (37)
(37)
The underlying statistical distribution for the p-chart is:
(Multiple Choice)
4.9/5 (29)
________ refers to how well the product or service performs its intended purpose.
(Short Answer)
4.7/5 (31)
Four samples of 100 each were taken from an assembly line, with the following results: 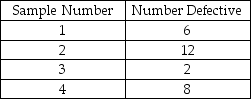 Using the historical average as the central line of the chart, which one of the following is the limit for an attributes control chart with z = 2?
(Multiple Choice)
4.7/5 (39)
What are the steps in the Six Sigma improvement model and how do they relate to the PDSA cycle?
(Essay)
4.9/5 (44)
Regarding control charts, changing from two-sigma limits to three-sigma limits:
(Multiple Choice)
4.8/5 (36)
The TQM pillar of ________ involves the use of tools such as process control and process capability.
(Short Answer)
4.9/5 (39)
Five samples of size 4 were taken from a process. A range chart was developed that had LCLR = 0 and UCLR = 2.50. Similarly, an average chart was developed with the average range from the five samples, with LCL = 15.0 and LCL = 24.0. The ranges for each of the five samples were 1.75, 2.42, 2.75, 2.04, and 2.80, respectively. The values of the sample average for each sample were 19.5, 22.3, 17.4, 20.1, and 18.9, respectively. What can you tell management from this analysis?
(Multiple Choice)
4.9/5 (36)
The notion of internal customers applies to all parts of a firm.
(True/False)
4.8/5 (39)
________ are small groups of supervisors and employees who meet to identify, analyze, and solve production and quality problems.
(Essay)
4.8/5 (29)
What are any three dimensions of quality and which one accurately describes how you assess education?
(Essay)
4.8/5 (32)
The internal failure known as ________ occurs when an item is unfit for further processing.
(Short Answer)
4.8/5 (29)
Describe the systems approach for total quality management by outlining the four pillars of TQM and discussing challenges organizations face in implementing this approach.
(Essay)
4.9/5 (41)
________ is a comprehensive and flexible system for achieving, sustaining, and maximizing business success through intensive data analysis and process management, improvement and reengineering.
(Short Answer)
4.8/5 (41)
The three sigma limits for a process whose distribution conforms to the normal distribution include approximately:
(Multiple Choice)
4.8/5 (34)
A manufacturer enjoys both a Cpk and a CP = 2.0. How high does the process mean have to drift (in number of standard deviations) away from target in order to result in a 1% chance of making a product out of specification? Illustrate this situation (both before shift and after shift) with a diagram.
(Essay)
4.8/5 (30)
Table 5.4
The manager of Champion Cooling Company has recently implemented a statistical process control method. The accompanying table shows the recorded temperatures of five different samples of walk-in coolers that were produced in the previous month.
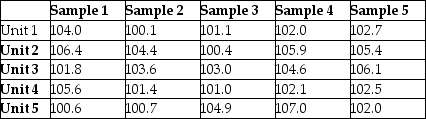 -Use the information in Table 5.4. The first point plotted on the x-bar chart has a value of:
(Multiple Choice)
5.0/5 (39)
Filters
- Essay(0)
- Multiple Choice(0)
- Short Answer(0)
- True False(0)
- Matching(0)