Exam 13: Multiple Regression Analysis
Exam 1: Describing Data With Graphs94 Questions
Exam 2: Describing Data With Numerical Measures186 Questions
Exam 3: Describing Bivariate Data35 Questions
Exam 4: Probability and Probability Distributions136 Questions
Exam 5: Several Useful Discrete Distributions129 Questions
Exam 6: The Normal Probability Distribution196 Questions
Exam 7: Sampling Distributions162 Questions
Exam 8: Large-Sample Estimation173 Questions
Exam 9: Large-Sample Tests of Hypotheses210 Questions
Exam 10: Inference From Small Samples261 Questions
Exam 11: The Analysis of Variance156 Questions
Exam 12: Linear Regression and Correlation165 Questions
Exam 13: Multiple Regression Analysis178 Questions
Exam 14: Analysis of Categorical Data136 Questions
Exam 15: Nonparametric Statistics198 Questions
Select questions type
In a multiple regression analysis, the regression equation  is obtained. The
  variable is quantitative variable, and the
  variable is a dummy variable with values 0 and 1. Given this information, we can interpret the slope coefficient (-3) on variable
  as follows: Holding
  constant, if the value of
  is changed from 0 to 1, the average value of y will decrease by 3 units.
(True/False)
4.8/5  (29)
(29)
In a multiple regression model, the standard deviation of the error variable  is assumed to be:
(Multiple Choice)
4.7/5 (42)
Plots of the residuals against  or against the individual independent variables
  often indicate departures from the assumptions required for an analysis of variance, and they also may suggest changes in the underlying model.
(True/False)
4.7/5 (35)
In a multiple regression problem involving 24 observations and three independent variables, the estimated regression equation is  . For this model, SST = 800 and SSE = 245. Then, the value of the F statistic for testing the significance of the model is 15.102.
(True/False)
4.9/5 (35)
A multiple regression equation includes 5 predictor variables, and the coefficient of multiple determination is 0.7921. The percentage of the variation in y that is explained by the regression equation is 89%.
(True/False)
4.9/5 (31)
In multiple regression analysis, the adjusted multiple coefficient of determination is adjusted for the number of independent variables and the sample size.
(True/False)
4.8/5 (40)
In reference to the multiple regression model  , if
, if  were to increase by five units, holding
  and
and  constant, then, the value of y would decrease on average by 50 units.
(True/False)
4.9/5 (28)
Residuals are the deviations between the observed values of y and their predicted values  .
.
(True/False)
4.9/5 (41)
For a multiple regression model, the following statistics are given: Total SS = 500, SSE = 60, and n = 20. The coefficient of determination, expressed as a percentage, is:
(Multiple Choice)
4.9/5 (39)
In a multiple regression model, it is assumed that the residuals are normally distributed.
(True/False)
4.8/5 (44)
What is stepwise regression, and when is it desirable to make use of this multiple regression technique?
(Essay)
4.9/5 (36)
A multiple regression equation includes 5 independent variables, and the coefficient of determination is 0.81. Then, the percentage of the variation in y that is explained by the regression equation is 90%.
(True/False)
4.9/5 (35)
When an additional explanatory variable is introduced into a multiple regression model, coefficient of multiple determination adjusted for degrees of freedom can never decrease.
(True/False)
4.7/5 (32)
A multiple regression model involves 5 independent variables and a sample of 10 data points. If we want to test the validity of the model at the 5% significance level, the critical value is:
(Multiple Choice)
4.8/5 (43)
Is personal spending linearly related to orders for durable goods and personal income? A recent study reported the amount of personal spending (in trillions of dollars), amount spent on durable goods (in billions of dollars), and personal income (in trillions of dollars). A statistical package was used to fit a linear regression model, producing the output below. 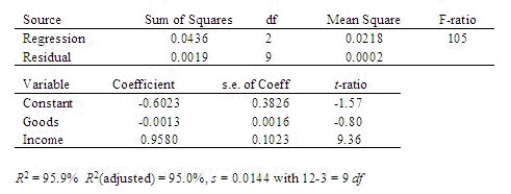 Write the model that was fit. Include the estimates of the parameters.
  = _______ + _______
  + _______
  Predict the level of personal spending when amount spent on durable goods is 130 and personal income is at 5.10.
______________
Use the computer output shown above to calculate 95% confidence intervals for the intercept and the partial regression coefficients.
What is the confidence interval for
Predict the level of personal spending when amount spent on durable goods is 130 and personal income is at 5.10.
______________
Use the computer output shown above to calculate 95% confidence intervals for the intercept and the partial regression coefficients.
What is the confidence interval for  ?
CI = ______________ Enter (n1, n2)
What is the confidence interval for
?
CI = ______________ Enter (n1, n2)
What is the confidence interval for  ?
CI = ______________ Enter (n1, n2)
What is the confidence interval for
?
CI = ______________ Enter (n1, n2)
What is the confidence interval for  ?
CI = ______________ Enter (n1, n2)
Based on your confidence intervals, does the amount spent on durable goods have any predictive power beyond that provided by the other independent variables for determining personal spending?
______________
Based on your confidence intervals, does personal income have any predictive power beyond that provided by the other independent variables for determining personal spending?
______________
Use the computer output shown above to test the hypotheses:
?
CI = ______________ Enter (n1, n2)
Based on your confidence intervals, does the amount spent on durable goods have any predictive power beyond that provided by the other independent variables for determining personal spending?
______________
Based on your confidence intervals, does personal income have any predictive power beyond that provided by the other independent variables for determining personal spending?
______________
Use the computer output shown above to test the hypotheses: 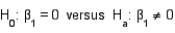 at the 5% significance level. What is your conclusion?
______________ the null hypothesis.
We conclude spending on durable goods ______________ predictive power over and above personal income to predict personal spending.
Use the computer output shown above to test the hypotheses
at the 5% significance level. What is your conclusion?
______________ the null hypothesis.
We conclude spending on durable goods ______________ predictive power over and above personal income to predict personal spending.
Use the computer output shown above to test the hypotheses 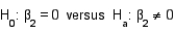 at the 5% significance level. What is your conclusion?
Conclude:
______________ the null hypothesis.
Personal income ______________ predictive power beyond that provided by the other independent variable.
at the 5% significance level. What is your conclusion?
Conclude:
______________ the null hypothesis.
Personal income ______________ predictive power beyond that provided by the other independent variable.
(Short Answer)
4.8/5 (38)
An automobile manufacturer would like to know the gas mileage of a car (y in miles per gallon) based on four predictor variables:  = horsepower (ft-lb),
  = torque (ft-lb),
  = displacement (cubic inches), and
  = weight (lbs). Suppose the following equation does indeed describe the true relationship.
 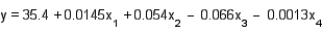 What is the gas mileage for a car with 160 ft-lbs of horsepower, 250 ft-lbs of torque, 350 cubic inches of displacement, and weighs 3900 pounds?
______________ miles/gallon
What is the gas mileage for a car with 210 ft-lbs of horsepower, 330 ft-lbs of torque, 440 cubic inches of displacement, and weighs 4210 pounds?
______________ miles/gallon
How would you interpret the value of
What is the gas mileage for a car with 160 ft-lbs of horsepower, 250 ft-lbs of torque, 350 cubic inches of displacement, and weighs 3900 pounds?
______________ miles/gallon
What is the gas mileage for a car with 210 ft-lbs of horsepower, 330 ft-lbs of torque, 440 cubic inches of displacement, and weighs 4210 pounds?
______________ miles/gallon
How would you interpret the value of  ?
________________________________________________________
How would you interpret the value of
?
________________________________________________________
How would you interpret the value of  ?
________________________________________________________
How would you interpret the value of
?
________________________________________________________
How would you interpret the value of  ?
________________________________________________________
How would you interpret the value of
?
________________________________________________________
How would you interpret the value of  ?
________________________________________________________
?
________________________________________________________
(Essay)
4.8/5 (39)
If the  value for a multiple regression model with two independent variables is .81, then the correlation between the two independent variables will be .90.
(True/False)
4.9/5 (29)
In order to incorporate qualitative variables into a regression model, one or more dummy variables are needed.
(True/False)
4.9/5 (21)
In multiple regression analysis, the coefficient of determination is sometimes called multiple  .
.
(True/False)
4.9/5 (29)
Filters
- Essay(0)
- Multiple Choice(0)
- Short Answer(0)
- True False(0)
- Matching(0)