Exam 13: Multiple Regression Analysis
Exam 1: Describing Data With Graphs94 Questions
Exam 2: Describing Data With Numerical Measures186 Questions
Exam 3: Describing Bivariate Data35 Questions
Exam 4: Probability and Probability Distributions136 Questions
Exam 5: Several Useful Discrete Distributions129 Questions
Exam 6: The Normal Probability Distribution196 Questions
Exam 7: Sampling Distributions162 Questions
Exam 8: Large-Sample Estimation173 Questions
Exam 9: Large-Sample Tests of Hypotheses210 Questions
Exam 10: Inference From Small Samples261 Questions
Exam 11: The Analysis of Variance156 Questions
Exam 12: Linear Regression and Correlation165 Questions
Exam 13: Multiple Regression Analysis178 Questions
Exam 14: Analysis of Categorical Data136 Questions
Exam 15: Nonparametric Statistics198 Questions
Select questions type
A chemist was interested in examining the effects of three chemicals on a chemical process yield. Let  , i = 1, 2, 3, represent the effects of the three chemicals, respectively and y be the process yield. The following output was generated using statistical software.
 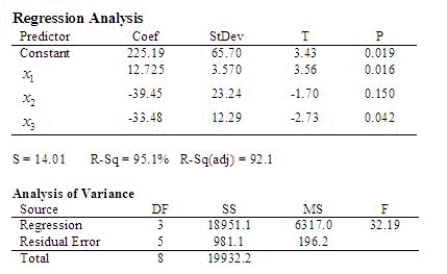 Find the least squares regression equation.
  = _______ + _______
  + _______
  + _______
  .
Test the usefulness of the model at the 0.05 level of significance.
The null and alternative hypotheses of interest are:
.
Test the usefulness of the model at the 0.05 level of significance.
The null and alternative hypotheses of interest are: 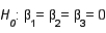 vs.
vs. 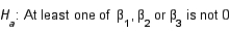 Test statistic:
F = ______________
Rejection region:
Reject H0 if F > ______________
Conclude:
______________
______________ of the predictor variables (one of the three chemicals) is contributing significant information for the prediction of the chemical process yield.
Which variable, if any, should be removed from the model if a 0.05 level of significance is desired?
______________
Test statistic:
F = ______________
Rejection region:
Reject H0 if F > ______________
Conclude:
______________
______________ of the predictor variables (one of the three chemicals) is contributing significant information for the prediction of the chemical process yield.
Which variable, if any, should be removed from the model if a 0.05 level of significance is desired?
______________
(Short Answer)
4.9/5  (29)
(29)
Americans are very vocal about their attempts to improve personal well-being by "eating right and exercising more." One desirable dietary change is to reduce the intake of red meat and to substitute poultry or fish. A medical team from Florida tracked beef and chicken consumption (in annual pounds per person) and found the consumption of beef declining and the consumption of chicken increasing from 1970 through the year 2000. A summary of their data is shown in the table.
 Consider fitting the following model, which allows for simultaneously fitting two simple linear regression lines: E(y) = 0+ 1x1 + 2x2+ 3x1x2 where
  Minitab printouts using this model are provided here.
Regression Analysis
The regression equation is
Y = -3020 + 4897 X1 + 1.55 X2 - 2.46 X1X2
Minitab printouts using this model are provided here.
Regression Analysis
The regression equation is
Y = -3020 + 4897 X1 + 1.55 X2 - 2.46 X1X2

 Analysis of Variance

 Predicted Value

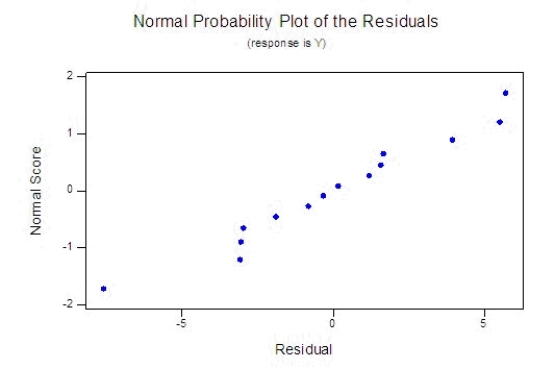
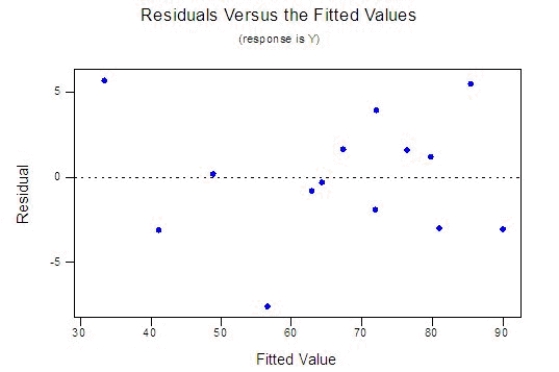 How well does the model fit? Use any relevant statistics and diagnostic tools from the printout to answer this question.
Test statistic:
F = ______________
p-value: ______________
Conclude:
The model ______________ significant information for the prediction of y.
Write the equations of the two straight lines that describe the trend in consumption over the period of 30 years for beef and for chicken.
For chicken:
How well does the model fit? Use any relevant statistics and diagnostic tools from the printout to answer this question.
Test statistic:
F = ______________
p-value: ______________
Conclude:
The model ______________ significant information for the prediction of y.
Write the equations of the two straight lines that describe the trend in consumption over the period of 30 years for beef and for chicken.
For chicken:  = _______ + _______
  For beef:
  = _______ + _______
  Use the prediction equation to find a point estimate of the average per-person beef consumption in 2005.
  = ______________
Compare this value with the value labeled "Fit" in the printout.
______________
Use the printout to find a 95% confidence interval for the average per-person beef consumption in 2005.
The confidence interval is:
CI = ______________ Enter (n1, n2)
What is the 95% prediction interval for the per-person beef consumption in 2005?
The 95% prediction interval is:
PI = ______________ Enter (n1, n2)
Is there any problem with the validity of the 95% confidence level for these intervals?
__________________________________________
= ______________
Compare this value with the value labeled "Fit" in the printout.
______________
Use the printout to find a 95% confidence interval for the average per-person beef consumption in 2005.
The confidence interval is:
CI = ______________ Enter (n1, n2)
What is the 95% prediction interval for the per-person beef consumption in 2005?
The 95% prediction interval is:
PI = ______________ Enter (n1, n2)
Is there any problem with the validity of the 95% confidence level for these intervals?
__________________________________________
(Essay)
4.9/5 (43)
The computer output for a multiple regression analysis including 15 observations and three predictor variables, x1, x2, and x3 provides the following information: 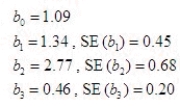 Which, if any, of the independent variables
  and
and  contribute information for the prediction of y?
Compute the t-statistic for each predictor variable and decide whether or not it is significant:
contribute information for the prediction of y?
Compute the t-statistic for each predictor variable and decide whether or not it is significant:  = ______________,
  ______________ significant.
  = ______________,
  ______________ significant.
  = ______________,
  ______________ significant.
Give the least-squares prediction equation.
______________ significant.
Give the least-squares prediction equation.  = _______ + _______
  + _______
  + _______
  .
What is the practical interpretation of the parameter
.
What is the practical interpretation of the parameter  ?
________________________________________________________
?
________________________________________________________
(Essay)
4.9/5 (32)
The adjusted coefficient of determination is adjusted for the number of independent variables in the model by using sum of squares rather mean squares.
(True/False)
4.9/5 (38)
In reference to the equation: 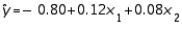 , the value -0.80 is the y-intercept.
(True/False)
4.8/5 (34)
A multiple regression model involves 3 predictor variables and a sample of 20 data points. If we want to test the usefulness of the model at the 1% significance level, the critical value of the rejection region is:
(Multiple Choice)
4.7/5 (34)
The coefficient of determination R2 represents the proportion of the total variability in y that can be explained by the regression of y on x. When transformed to a percentage, it represents the percentage reduction in the sum of the squares of the error that can be accomplished by using the model to predict the dependent variable as opposed to just using the sample mean of the dependent variable.
(True/False)
4.8/5 (33)
In a multiple regression model, there are 10 independent variables included in the model. Therefore the sample size should be at least 10.
(True/False)
4.8/5 (41)
A regression model of the form 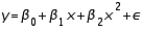 is called a quadratic model or a second-order polynomial model.
(True/False)
4.9/5 (35)
A multiple regression model has the form 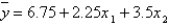 . As
. As  increases by one unit, holding
  constant, the value of y will increase by 9 units.
(True/False)
4.7/5 (22)
To test the validity of a multiple regression model, we test the null hypothesis that the regression coefficients are all zero by applying:
(Multiple Choice)
4.8/5 (35)
When multicollinearity is present, the estimated regression coefficients will have large standard error, causing imprecision in confidence and prediction intervals.
(True/False)
4.7/5 (29)
For each x term in the multiple regression equation, the corresponding  is referred to as a partial regression coefficient.
(True/False)
4.8/5 (24)
Multiple regression analysis is a type of regression analysis in which several independent variables are used to estimate the value of an unknown dependent variable; hence, each of these predictor variables explains part of the total variation of the dependent variable.
(True/False)
4.8/5 (33)
Which of the following statements regarding multicollinearity is not true?
(Multiple Choice)
4.8/5 (28)
A multiple regression model involves 5 predictor variables and 30 observations. If we want to test the hypotheses 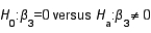 at the 5% significance level, the critical value of the rejection region will be:
(Multiple Choice)
4.9/5 (38)
A three-variable multiple regression establishes an estimated multiple regression equation in such a way that:
(Multiple Choice)
4.8/5 (41)
Filters
- Essay(0)
- Multiple Choice(0)
- Short Answer(0)
- True False(0)
- Matching(0)