Exam 13: Multiple Regression Analysis
Exam 1: Describing Data With Graphs94 Questions
Exam 2: Describing Data With Numerical Measures186 Questions
Exam 3: Describing Bivariate Data35 Questions
Exam 4: Probability and Probability Distributions136 Questions
Exam 5: Several Useful Discrete Distributions129 Questions
Exam 6: The Normal Probability Distribution196 Questions
Exam 7: Sampling Distributions162 Questions
Exam 8: Large-Sample Estimation173 Questions
Exam 9: Large-Sample Tests of Hypotheses210 Questions
Exam 10: Inference From Small Samples261 Questions
Exam 11: The Analysis of Variance156 Questions
Exam 12: Linear Regression and Correlation165 Questions
Exam 13: Multiple Regression Analysis178 Questions
Exam 14: Analysis of Categorical Data136 Questions
Exam 15: Nonparametric Statistics198 Questions
Select questions type
In a multiple regression analysis involving 50 observations and 5 independent variables, SST = 475 and SSE = 71.25. Then, the multiple coefficient of determination is 0.85.
(True/False)
4.7/5  (25)
(25)
The adjusted multiple coefficient of determination is adjusted for the:
(Multiple Choice)
4.8/5 (31)
In constructing a multiple regression model with two independent variables  and
and  it was known that the correlation between
  and y is .75, and the correlation between
  and y is .55. Based on this information, the regression model containing both independent variable will explain 65% of the variation in the dependent variable y.
(True/False)
4.9/5 (32)
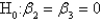
Consider the following partial output generated using Minitab: 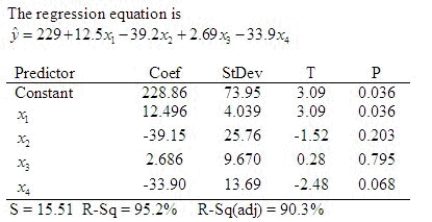 Which, if any, of the terms should be removed from the model first?
______________
Justify your answer. (Use a significance level of 0.05.)
It has ______________ p-value.
Which of the predictors makes the most significant contribution in predicting the dependent variable y?
______________
Justify your answer.
It has ______________ p-value.
What is the coefficient of determination?
Which, if any, of the terms should be removed from the model first?
______________
Justify your answer. (Use a significance level of 0.05.)
It has ______________ p-value.
Which of the predictors makes the most significant contribution in predicting the dependent variable y?
______________
Justify your answer.
It has ______________ p-value.
What is the coefficient of determination?  = ______________.
Interpret the value.
______________
= ______________.
Interpret the value.
______________
(Essay)
4.9/5 (36)
Same statistical packages print a second  statistic, called the adjusted coefficient of determination, which has been adjusted for the degrees of freedom to take into account the sample size and the number of predictor variables.
(True/False)
4.9/5 (34)
In multiple regression analysis, when the response surface (the graphical depiction of the regression equation) hits every single point, the sum of squares for error SSE = 0, the standard error of estimate  = 0, and the coefficient of determination
  = 1.
= 1.
(True/False)
4.7/5 (31)
Suppose you have a choice of three multiple linear regression models. Listed below are the independent variables (predictors) and the values of  and adjusted
  for each model.
 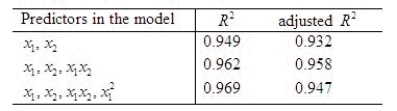 Which model would you choose as the most appropriate to use?
____________________________
Which model would you choose as the most appropriate to use?
____________________________
(Short Answer)
4.8/5 (38)
In a multiple regression model, the partial regression slope coefficients measure the average change in the dependent variable for a one-unit change in the dependent variable of interest, with all other independent variables held constant.
(True/False)
4.9/5 (29)
In stepwise regression procedure, if two independent variables are highly correlated, then:
(Multiple Choice)
4.8/5 (34)
The t-distribution with df = n - 2 is used for testing a specific set of regression coefficients,e.g.,
 .
.
(True/False)
4.8/5 (32)
In multiple regression analysis, which procedure permits variables to enter and leave the model at different stages of its development?
(Multiple Choice)
4.9/5 (34)
A medical study investigated the link between obesity and television viewing habits in children. One part of the study involved characterizing the difference in viewing habits between boys and girls. A regression model was used to compare the number of hours of television watched per week by boys with the number watched by girls. Use the computer printout below to determine whether there is a significant difference between these two groups. The variable named "Gender" in the printout is equal to one if the subject was female, and zero if the subject was male. 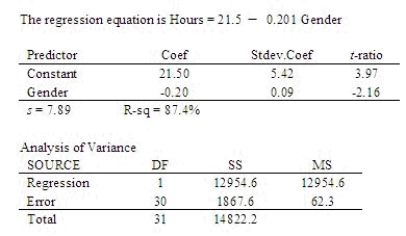 State your conclusion based on a 0.05 significance level.
There ______________ a significant difference in TV viewing habits between boys and girls.
State your conclusion based on a 0.05 significance level.
There ______________ a significant difference in TV viewing habits between boys and girls.
(Short Answer)
4.9/5 (29)
Stepwise regression analysis is a procedure that is implemented by computer and is available in most statistical packages. It is mainly used to determine which of a large number of independent variables should be included in the model.
(True/False)
4.9/5 (42)
The coefficient of multiple determination is calculated by dividing the regression sum of squares by the total sum of squares (SSR/SST) and subtracting that value from 1.
(True/False)
4.9/5 (30)
Let  be the least squares estimate of the population coefficient
  . If the regression assumptions hold true, the test statistic given by
  has an F distribution with k and n-k-1 degrees of freedom, where n is the number of observations and k is the number of predictor variables.
(True/False)
4.8/5 (41)
An actuary wanted to develop a model to predict how long individuals will live. After consulting a number of physicians, she collected the age at death (y), the average number of hours of exercise per week (x1), the cholesterol level (x2), and the number of points that the individual's blood pressure exceeded the recommended value (x3). A random sample of 40 individuals was selected. The computer output of the multiple regression model is shown below. 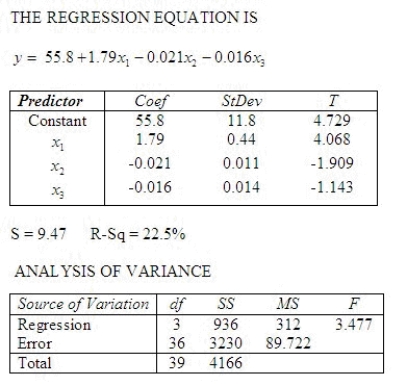 Is there enough evidence at the 10% significance level to infer that the model is useful in predicting length of life?
______________ enough evidence at the 10% significance level to infer that the model is useful in predicting length of life.
Is there enough evidence at the 1% significance level to infer that the average number of hours of exercise per week and the age at death are linearly related?
What is the test statistic?
t = ______________
Conclude:
______________
Is there enough evidence at the 10% significance level to infer that the model is useful in predicting length of life?
______________ enough evidence at the 10% significance level to infer that the model is useful in predicting length of life.
Is there enough evidence at the 1% significance level to infer that the average number of hours of exercise per week and the age at death are linearly related?
What is the test statistic?
t = ______________
Conclude:
______________  .
There ______________ enough evidence at the 1% significance level to infer that the average number of hours of exercise per week and the age at death are linearly related.
Is there enough evidence at the 5% significance level to infer that the cholesterol level and the age at death are negatively linearly related?
What is the test statistic?
t = ______________
Conclude:
______________
.
There ______________ enough evidence at the 1% significance level to infer that the average number of hours of exercise per week and the age at death are linearly related.
Is there enough evidence at the 5% significance level to infer that the cholesterol level and the age at death are negatively linearly related?
What is the test statistic?
t = ______________
Conclude:
______________  .
There ______________ enough evidence at the 5% significance level to infer that the cholesterol level and the age at death are negatively linearly related.
Is there sufficient evidence at the 5% significance level to infer that the number of points that the individual's blood pressure exceeded the recommended value and the age at death are negatively linearly related?
What is the test statistic?
t = ______________
Conclude:
______________
.
There ______________ enough evidence at the 5% significance level to infer that the cholesterol level and the age at death are negatively linearly related.
Is there sufficient evidence at the 5% significance level to infer that the number of points that the individual's blood pressure exceeded the recommended value and the age at death are negatively linearly related?
What is the test statistic?
t = ______________
Conclude:
______________  .
There ______________ sufficient evidence at the 5% significance level to infer that the number of points that the individual's blood pressure exceeded the recommended value and the age at death are negatively linearly related.
What is the coefficient of determination?
.
There ______________ sufficient evidence at the 5% significance level to infer that the number of points that the individual's blood pressure exceeded the recommended value and the age at death are negatively linearly related.
What is the coefficient of determination?  ______________
Explain:
________________________________________________________
______________
Explain:
________________________________________________________
(Essay)
4.9/5 (41)
Filters
- Essay(0)
- Multiple Choice(0)
- Short Answer(0)
- True False(0)
- Matching(0)