Exam 13: Multiple Regression Analysis
Exam 1: Describing Data With Graphs94 Questions
Exam 2: Describing Data With Numerical Measures186 Questions
Exam 3: Describing Bivariate Data35 Questions
Exam 4: Probability and Probability Distributions136 Questions
Exam 5: Several Useful Discrete Distributions129 Questions
Exam 6: The Normal Probability Distribution196 Questions
Exam 7: Sampling Distributions162 Questions
Exam 8: Large-Sample Estimation173 Questions
Exam 9: Large-Sample Tests of Hypotheses210 Questions
Exam 10: Inference From Small Samples261 Questions
Exam 11: The Analysis of Variance156 Questions
Exam 12: Linear Regression and Correlation165 Questions
Exam 13: Multiple Regression Analysis178 Questions
Exam 14: Analysis of Categorical Data136 Questions
Exam 15: Nonparametric Statistics198 Questions
Select questions type
In a multiple regression analysis involving 6 independent variables, the sum of squares are calculated as: Total SS = 900, SSR = 600 and SSE = 300. Then, the value of the F-test statistic for this model is:
(Multiple Choice)
4.8/5  (36)
(36)
Consider a multiple regression model with three independent variables. If the y-intercept is negative, then at least two of the partial regression slope coefficients will also be negative.
(True/False)
4.9/5 (38)
The more predictors that are added to a regression model, the larger the coefficient of determination R2 value will be.
(True/False)
4.8/5 (36)
A statistician wanted to determine if the demographic variables of age, education, and income influence the number of hours of television watched per week. A random sample of 25 adults was selected to estimate the multiple regression model:  where y is the number of hours of television watched last week, x1 is the age (in years), x2 is the number of years of education, and x3 is income (in $1,000). The computer output is shown below.
 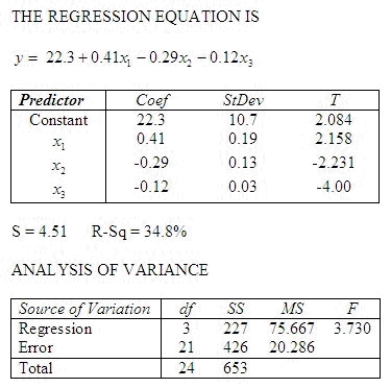 Test the overall validity of the model at the 5% significance level.
What is the test statistic?
F = ______________
______________
Test the overall validity of the model at the 5% significance level.
What is the test statistic?
F = ______________
______________  Conclude that the model ______________ valid at the 5% level.
Is there sufficient evidence at the 1% significance level to indicate that hours of television watched and age are linearly related?
What is test statistic?
t = ______________
______________
Conclude that the model ______________ valid at the 5% level.
Is there sufficient evidence at the 1% significance level to indicate that hours of television watched and age are linearly related?
What is test statistic?
t = ______________
______________  Conclude that there ______________ sufficient evidence at the 1% significance level to indicate that hours of television watched and age are linearly related.
Is there sufficient evidence at the 1% significance level to indicate that hours of television watched and education are negatively linearly related?
What is the test statistic?
t = ______________
______________
Conclude that there ______________ sufficient evidence at the 1% significance level to indicate that hours of television watched and age are linearly related.
Is there sufficient evidence at the 1% significance level to indicate that hours of television watched and education are negatively linearly related?
What is the test statistic?
t = ______________
______________  Conclude that there ______________ sufficient evidence at the 1% significance level to indicate that hours of television watched and education are negatively linearly related.
What is the coefficient of determination?
Conclude that there ______________ sufficient evidence at the 1% significance level to indicate that hours of television watched and education are negatively linearly related.
What is the coefficient of determination?  = ______________
Interpret this value for
= ______________
Interpret this value for  :
________________________________________________________
Interpret
:
________________________________________________________
Interpret  :
________________________________________________________
Interpret
:
________________________________________________________
Interpret  :
________________________________________________________
Interpret
:
________________________________________________________
Interpret  :
________________________________________________________
:
________________________________________________________
(Essay)
4.9/5 (41)
Multiple regression is the process of using several independent variables to predict a number of dependent variables.
(True/False)
4.7/5 (28)
In multiple regression, the prediction equation  is the line that minimizes SSE, the sum of squares of the deviations of the observed values y from the predicted values
  .
.
(True/False)
4.9/5 (32)
The test statistic F found in the ANOVA table for testing the usefulness of the regression model is calculated by:
(Multiple Choice)
4.9/5 (37)
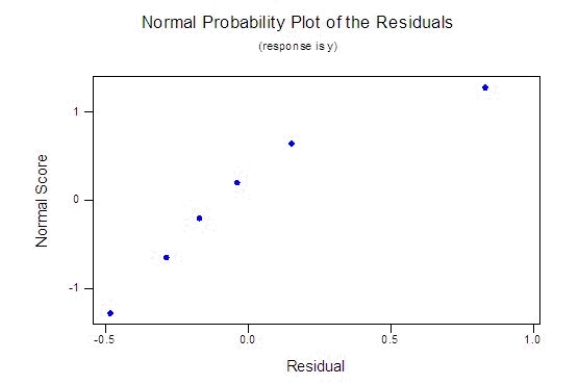
A publisher of college textbooks conducted a study to relate profit per text y to cost of sales x over a 6-year period when its sales force (and sales costs) were growing rapidly. These inflation-adjusted data (in thousands of dollars) were collected: 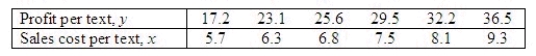 Expecting profit per book to rise and then plateau, the publisher fitted the model
 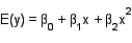 to the data. What conclusions can you draw from the accompanying residual plots?
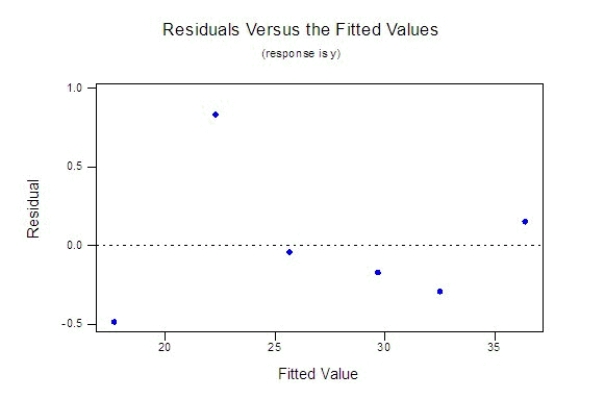
(Essay)
4.8/5 (24)
In reference to the equation 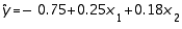 , the value -0.75 is the intercept.
(True/False)
4.8/5 (41)
Given a multiple regression with a regression sum of squares of 850 and a total sum of square of 1,000, the coefficient of multiple determination:
(Multiple Choice)
4.8/5 (33)
The larger the value of the coefficient of multiple determination  the larger the value of the F-test statistic that is used for testing the usefulness of the multiple regression model.
(True/False)
4.9/5 (35)
In testing the validity of a multiple regression model involving 10 independent variables and 100 observations, the numerator and denominator degrees of freedom for the critical value of F will be, respectively,
(Multiple Choice)
4.8/5 (33)
Use the following partial output and residual plot generated using statistical software to determine whether there are any potential outliers in this data. 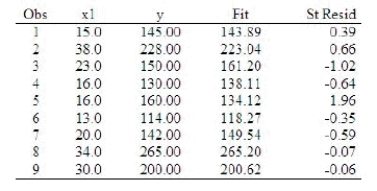
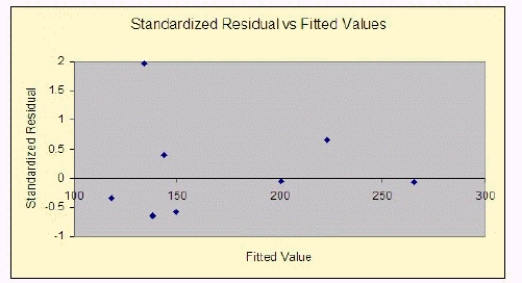 What are the potential outliers?
______________ Enter the observation numbers 1-9, separated by commas if there is more than one.
Explain:
________________________________________________________
What are the potential outliers?
______________ Enter the observation numbers 1-9, separated by commas if there is more than one.
Explain:
________________________________________________________
(Essay)
4.9/5 (30)
In testing the significance of a multiple regression model in which there are three independent variables, the null hypothesis is  .
.
(True/False)
4.9/5 (29)
A publisher is studying the effectiveness of advertising to sell a woman's magazine. She wishes to investigate the relationship between the number of magazines sold (10,000's), the "reach" (proportion of the population who see at least one advertisement for the magazine), and the average income of the target market ($1,000's). The publisher suspects people at certain income levels might be more susceptible to this advertising campaign than others. Preliminary studies show there is no evidence of a quadratic relationship between sales and either of the other two variables. Use the output below to answer the questions. 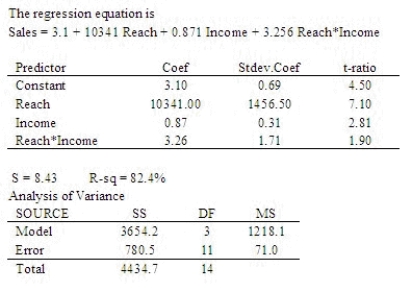 Is there an interaction effect? Test at the 5% significance level.
One may conclude that there ______________ interaction between the "reach" (proportion of the population who see at least one advertisement for the magazine), and the average income of the target market.
Develop 95% confidence intervals for the intercept and the partial regression coefficients.
The confidence interval for
Is there an interaction effect? Test at the 5% significance level.
One may conclude that there ______________ interaction between the "reach" (proportion of the population who see at least one advertisement for the magazine), and the average income of the target market.
Develop 95% confidence intervals for the intercept and the partial regression coefficients.
The confidence interval for  is:
CI = ______________ Enter (n1, n2)
The confidence interval for
is:
CI = ______________ Enter (n1, n2)
The confidence interval for  is:
C I= ______________ Enter (n1, n2)
The confidence interval for
is:
C I= ______________ Enter (n1, n2)
The confidence interval for  is:
CI = ______________ Enter (n1, n2)
The confidence interval for
is:
CI = ______________ Enter (n1, n2)
The confidence interval for  is:
CI = ______________ Enter (n1, n2)
Explain how to use the 95% confidence interval you constructed for
is:
CI = ______________ Enter (n1, n2)
Explain how to use the 95% confidence interval you constructed for  to test the hypotheses made earlier.
We ______________ the null hypothesis at the 5% significance level.
to test the hypotheses made earlier.
We ______________ the null hypothesis at the 5% significance level.
(Short Answer)
5.0/5 (33)
In a multiple regression problem, the regression equation is 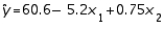 . The estimated value for y when
  and
and  is 48.
(True/False)
4.9/5 (35)
Consider a multiple linear regression model:  . Which of the following statements, if any, is true?
(Multiple Choice)
4.8/5 (30)
In a regression setting, which of the following, if any, is true?
(Multiple Choice)
4.8/5 (38)
In reference to the equation 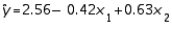 , the value 0.63 is the average change in y per unit change in
  , regardless of the value of
  .
.
(True/False)
4.9/5 (34)
Filters
- Essay(0)
- Multiple Choice(0)
- Short Answer(0)
- True False(0)
- Matching(0)