Exam 7: Process Strategies
Exam 1: Operations and Productivity138 Questions
Exam 2: Operations Strategy in a Global Environment134 Questions
Exam 3: Project Management131 Questions
Exam 4: Forecasting148 Questions
Exam 5: Design of Goods and Services126 Questions
Exam 6: Managing Quality226 Questions
Exam 7: Process Strategies259 Questions
Exam 8: Location Strategies233 Questions
Exam 9: Human Resources, Job Design, and Work Measurement321 Questions
Exam 10: Supply Chain Management158 Questions
Exam 11: Inventory Management230 Questions
Exam 12: Aggregate Planning and Sop122 Questions
Exam 13: Material Requirements Planning Mrp and Erp133 Questions
Exam 14: Short-Term Scheduling124 Questions
Exam 15: Lean Operations122 Questions
Exam 16: Maintenance and Reliability119 Questions
Exam 17: Decision-Making Tools101 Questions
Exam 18: Linear Programming102 Questions
Exam 19: Transportation Models92 Questions
Exam 20: Waiting-Line Models126 Questions
Exam 21: Learning Curves114 Questions
Exam 22: Simulation78 Questions
Exam 23: Applying Analytics to Big Data in Operations Management61 Questions
Select questions type
Plots of sample ranges indicate that the most recent value is below the lower control limit. What course of action would you recommend?
(Multiple Choice)
4.7/5  (37)
(37)
The strategy for improving service productivity that customizes at delivery, rather than at production, is ________.
(Short Answer)
4.9/5 (38)
The usual purpose of an R-chart is to signal whether there has been a:
(Multiple Choice)
4.9/5 (34)
A production process with only natural causes of variation is always capable of producing within the limits.
(True/False)
4.8/5 (25)
Which of the following is TRUE regarding the relationship between AOQ and the true population percent defective?
(Multiple Choice)
4.9/5 (37)
What is a drawing of the movement of material, product, or people?
(Multiple Choice)
4.8/5 (35)
Which of the following companies use a mass customization approach?
(Multiple Choice)
4.9/5 (36)
Ten samples of a process measuring the number of returns per 200 receipts were taken for a local retail store. The number of returns were 10, 9, 11, 7, 3, 12, 8, 4, 6, and 11. Find the standard deviation of the sampling distribution for the p-bar chart.
(Multiple Choice)
4.9/5 (41)
Which of the following are all strategies for improving productivity in services?
(Multiple Choice)
4.9/5 (35)
A firm's process strategy is its approach to transforming resources into goods and services.
(True/False)
5.0/5 (36)
What is the link between focused processes and specialization? What kinds of focus are possible?
(Essay)
5.0/5 (47)
Identify nine areas of technology that enhance production and productivity.
(Essay)
4.8/5 (38)
A firm is about to undertake the manufacture of a product, and it is weighing the process configuration options. There are two intermittent processes under consideration, as well as a repetitive focus. The smaller intermittent process has fixed costs of $4,300 per month and variable costs of $9 per unit. The larger intermittent process has fixed costs of $12,000 per month and variable costs of $2 per unit. A repetitive focus plant has fixed costs of $30,000 per month and variable costs of $0.80 per unit.
(a) At what output does the large intermittent process become cheaper than the small one?
(b) At what output does the repetitive process become cheaper than the larger intermittent process?
(Essay)
4.8/5 (38)
The probability of rejecting a good lot is known as producer's risk.
(True/False)
4.9/5 (42)
Jus de Fruit Co. has set up for automated production of its new bottled Triple Berry Colada. Five samples were taken during the first week of production. The OM team wants to monitor the dispersion of the process. What chart should they use? Is the process in control? 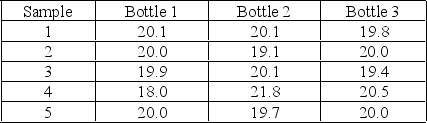
(Multiple Choice)
4.8/5 (28)
If a sample of items is taken and the mean of the sample is outside the control limits, the process is:
(Multiple Choice)
4.8/5 (40)
Filters
- Essay(0)
- Multiple Choice(0)
- Short Answer(0)
- True False(0)
- Matching(0)