Exam 7: Process Strategies
Exam 1: Operations and Productivity138 Questions
Exam 2: Operations Strategy in a Global Environment134 Questions
Exam 3: Project Management131 Questions
Exam 4: Forecasting148 Questions
Exam 5: Design of Goods and Services126 Questions
Exam 6: Managing Quality226 Questions
Exam 7: Process Strategies259 Questions
Exam 8: Location Strategies233 Questions
Exam 9: Human Resources, Job Design, and Work Measurement321 Questions
Exam 10: Supply Chain Management158 Questions
Exam 11: Inventory Management230 Questions
Exam 12: Aggregate Planning and Sop122 Questions
Exam 13: Material Requirements Planning Mrp and Erp133 Questions
Exam 14: Short-Term Scheduling124 Questions
Exam 15: Lean Operations122 Questions
Exam 16: Maintenance and Reliability119 Questions
Exam 17: Decision-Making Tools101 Questions
Exam 18: Linear Programming102 Questions
Exam 19: Transportation Models92 Questions
Exam 20: Waiting-Line Models126 Questions
Exam 21: Learning Curves114 Questions
Exam 22: Simulation78 Questions
Exam 23: Applying Analytics to Big Data in Operations Management61 Questions
Select questions type
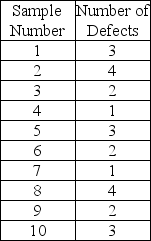
Larry's boat shop wants to monitor the number of blemishes in the paint of each boat. Construct a 3-sigma c-chart to determine if their paint process is in control using the following data.
(Essay)
4.9/5  (33)
(33)
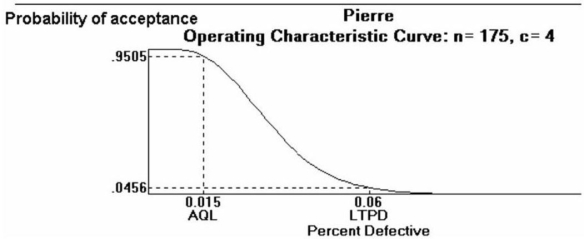
Pierre's Motorized Pirogues and Mudboats is setting up an acceptance sampling plan for the special air cleaners he manufactures for his boats. His specifications, and the resulting plan, are shown on the POM for Windows output below. Pierre is a bit confused. He mistakenly thinks that acceptance sampling will reject all bad lots and accept all good lots. Explain why this will not happen.
(Essay)
4.8/5 (33)
A process range chart illustrates the amount of dispersion within the samples.
(True/False)
4.8/5 (33)
Up to three standard deviations above or below the centerline is the amount of variation that statistical process control allows for:
(Multiple Choice)
4.8/5 (39)
What are the three possible results (or findings) from the use of control charts?
(Essay)
4.7/5 (47)
Flowcharts use distance, but not time, to show the movement of material, product, or people through a process.
(True/False)
4.8/5 (37)
Fast-food restaurants usually adopt a product-focused strategy for their processes.
(True/False)
5.0/5 (30)
A quality analyst wants to construct a sample mean chart for controlling a packaging process. He knows from past experience that when the process is operating as intended, packaging weight is normally distributed with a mean of twenty ounces, and a process standard deviation of two ounces. Each day last week, he randomly selected four packages and weighed each. The data from that activity appear below.
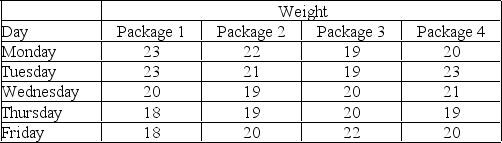 (a) If he sets an upper control limit of 21 and a lower control limit of 19 around the target value of twenty ounces, the control chart is based on what value of z?
(b) With the UCL and LCL of part a, what do you conclude about this process-is it in control?
(a) If he sets an upper control limit of 21 and a lower control limit of 19 around the target value of twenty ounces, the control chart is based on what value of z?
(b) With the UCL and LCL of part a, what do you conclude about this process-is it in control?
(Essay)
4.8/5 (46)
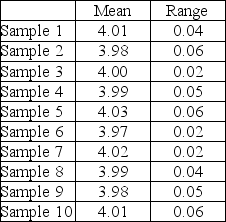
A part that connects two levels should have a distance between the two holes of 4". It has been determined that x-bar and R-charts should be set up to determine if the process is in statistical control. The following ten samples of size four were collected. Calculate the control limits, plot the control charts, and determine if the process is in control.
(Essay)
4.8/5 (35)
The x-bar chart indicates that a gain or loss of uniformity has occurred in the central tendency of a production process.
(True/False)
4.9/5 (35)
Mean charts and range charts complement one another, one detecting shifts in process average, the other detecting shifts in process dispersion.
(True/False)
4.7/5 (31)
The Central Limit Theorem states that when the sample size decreases, the distribution of the sample means will approach the normal distribution.
(True/False)
4.9/5 (25)
________ represent an organization's attempt to gain increased efficiency through specialization, which can include, for example, concentrating on certain classes of customers.
(Short Answer)
4.8/5 (40)
The causes of variation in statistical process control are:
(Multiple Choice)
4.8/5 (33)
The x-bar chart, like the c-chart, is based on the exponential distribution.
(True/False)
4.8/5 (48)
If = 23 ounces, σ = 1.0 ounces, and n = 16, what will be the ± 3σ control limits for the x-bar chart? 
(Multiple Choice)
4.9/5 (36)
Filters
- Essay(0)
- Multiple Choice(0)
- Short Answer(0)
- True False(0)
- Matching(0)