Exam 16: Simple Linear Regression and Correlat
Exam 1: What Is Statistics41 Questions
Exam 2: Graphical and Tabular Descriptive Techniques199 Questions
Exam 3: Numerical Descriptive Techniques226 Questions
Exam 4: Data Collection and Sampling82 Questions
Exam 5: Probability212 Questions
Exam 6: Random Variables and Discrete Probability Distributions174 Questions
Exam 7: Continuous Probability Distributions167 Questions
Exam 8: Sampling Distributions133 Questions
Exam 9: Introduction to Estimation88 Questions
Exam 10: Introduction to Hypothesis Testing186 Questions
Exam 11: Inference About a Population76 Questions
Exam 12: Inference About Comparing Two Populat85 Questions
Exam 13: Inference About Comparing Two Populat85 Questions
Exam 14: Analysis of Variance127 Questions
Exam 15: Chi-Squared Tests118 Questions
Exam 16: Simple Linear Regression and Correlat238 Questions
Exam 17: Multiple Regression147 Questions
Exam 18: Review of Statistical Inference189 Questions
Select questions type
Accidents and Rain A statistician investigating the relationship between the amount of rain (in inches)and the number of automobile accidents gathered data on accidents in her city for 10 randomly selected days throughout the year. The results are shown below. 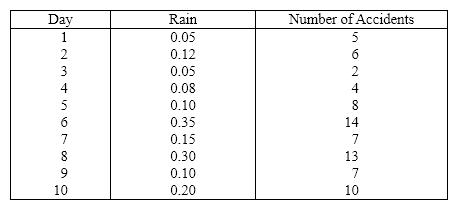 {Accidents and Rain Narrative} Find the least squares regression line.
(Essay)
4.9/5  (36)
(36)
Allman Brothers Concert At a recent Allman Brothers concert, a survey was conducted that asked a random sample of 20 people their age and how many concerts they have attended since the first of the year. The following data were collected: 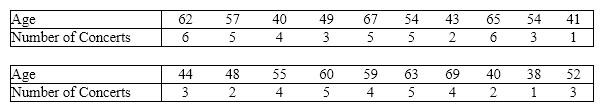 An Excel output follows:
 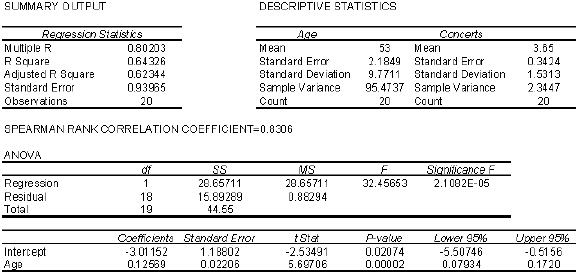 {Allman Brothers Concert Narrative} Determine the least squares regression line.
(Essay)
4.9/5 (38)
UV's and Skin Cancer A medical statistician wanted to examine the relationship between the amount of UV's ( x )and incidence of skin cancer ( y ). As an experiment he found the number of skin cancers detected per 100,000 of population and the average daily sunshine in eight states around the country. These data are shown below.  {UV's and Skin Cancer Narrative} What does the coefficient of correlation calculated tell you about the direction and strength of the relationship between the two variables?
(Essay)
4.8/5 (25)
Movie Revenues A financier whose specialty is investing in movie productions has observed that, in general, movies with "big-name" stars seem to generate more revenue than those movies whose stars are less well known. To examine his belief he records the gross revenue and the payment (in $ millions)given to the two highest-paid performers in the movie for ten recently released movies.  {Movie Revenues Narrative} Which interval in the previous two questions is narrower: the confidence interval estimate of the expected value of y or the prediction interval for the same given value of x (10 years)and same confidence level? Why?
(Essay)
4.8/5 (38)
Income and Education A professor of economics wants to study the relationship between income ( y in $1000s)and education ( x in years). A random sample eight individuals is taken and the results are shown below. 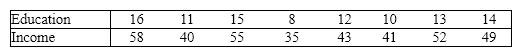 {Income and Education Narrative} Draw a scatter diagram of the data. Comment on whether it appears that a linear model might be appropriate.
(Essay)
4.7/5 (38)
A regression analysis between sales (in $1000)and advertising (in $100)resulted in the following least squares line:  . This implies that if advertising is $800, then the predicted amount of sales (in dollars)is:
(Multiple Choice)
5.0/5 (45)
In a simple linear regression model b 1 is the ____________________ of the straight line.
(Short Answer)
4.9/5 (37)
In simple linear regression, most often we perform a two-tail test of the population slope b 1 to determine whether there is sufficient evidence to infer that a linear relationship exists. The null hypothesis is stated as:
(Multiple Choice)
4.9/5 (38)
The confidence interval estimate of the expected value of y for a given value x , compared to the prediction interval of y for the same given value of x and confidence level, will be:
(Multiple Choice)
4.8/5 (30)
Movie Revenues A financier whose specialty is investing in movie productions has observed that, in general, movies with "big-name" stars seem to generate more revenue than those movies whose stars are less well known. To examine his belief he records the gross revenue and the payment (in $ millions)given to the two highest-paid performers in the movie for ten recently released movies. 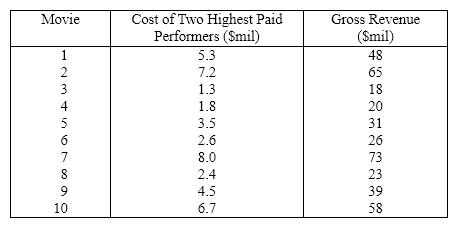 {Movie Revenues Narrative} Predict with 95% confidence the gross revenue of a movie whose top two stars earn $5.0 million.
(Essay)
4.7/5 (36)
Game Winnings & Education An ardent fan of television game shows has observed that, in general, the more educated the contestant, the less money he or she wins. To test her belief she gathers data about the last eight winners of her favorite game show. She records their winnings in dollars and the number of years of education. The results are as follows. 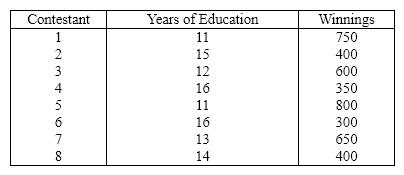 {Game Winnings & Education Narrative} Estimate with 95% confidence the average winnings of all contestants who have 10 years of education.
(Essay)
4.7/5 (27)
In simple linear regression, the denominator of the standard error of estimate s e is  .
.
(True/False)
4.9/5 (33)
Truck Speed vs Gas Mileage An economist wanted to analyze the relationship between the speed of a car ( x )and its gas mileage ( y ). As an experiment a car is operated at several different speeds and for each speed the gas mileage is measured. These data are shown below. 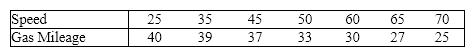 {Truck Speed vs Gas Mileage Narrative} Determine the least squares regression line.
(Essay)
4.9/5 (35)
Correlation analysis is used to determine whether there is a linear relationship between an independent variable x and a dependent variable y .
(True/False)
4.8/5 (29)
In the least squares regression line  , the predicted value of y equals:
(Multiple Choice)
4.9/5 (36)
Rock Concert Revenues A financier whose specialty is investing in rock concerts has observed that, in general, concerts with "big-name" stars seem to generate more revenue than those concerts whose stars are less well known. To examine his belief he records the gross revenue and the payment (in $ millions)given to the two highest-paid performers in the concert for ten concert tours. 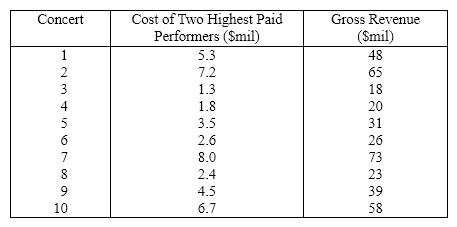 {Rock Concert Revenues Narrative} Calculate the Pearson correlation coefficient. Interpret the results.
(Essay)
4.8/5 (36)
A scatter diagram includes the following data points: 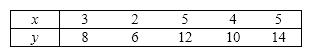 Two regression models are proposed: (1)
  , and (2)
  . Using the least squares method, which of these regression models provides the better fit to the data? Why?
(Essay)
4.7/5 (39)
The method statisticians use to produce a straight line that minimizes the SSE is called the ____________________ method.
(Short Answer)
4.8/5 (27)
In order to predict with 90% confidence the expected value of y for a given value of x in a simple linear regression problem, a random sample of 10 observations is taken. Which of the following t -table values listed below would be used?
(Multiple Choice)
4.8/5 (32)
There is more error in estimating a mean value of y as opposed to predicting an individual value of y .
(True/False)
4.8/5 (33)
Filters
- Essay(0)
- Multiple Choice(0)
- Short Answer(0)
- True False(0)
- Matching(0)