Exam 16: Simple Linear Regression and Correlat
Exam 1: What Is Statistics41 Questions
Exam 2: Graphical and Tabular Descriptive Techniques199 Questions
Exam 3: Numerical Descriptive Techniques226 Questions
Exam 4: Data Collection and Sampling82 Questions
Exam 5: Probability212 Questions
Exam 6: Random Variables and Discrete Probability Distributions174 Questions
Exam 7: Continuous Probability Distributions167 Questions
Exam 8: Sampling Distributions133 Questions
Exam 9: Introduction to Estimation88 Questions
Exam 10: Introduction to Hypothesis Testing186 Questions
Exam 11: Inference About a Population76 Questions
Exam 12: Inference About Comparing Two Populat85 Questions
Exam 13: Inference About Comparing Two Populat85 Questions
Exam 14: Analysis of Variance127 Questions
Exam 15: Chi-Squared Tests118 Questions
Exam 16: Simple Linear Regression and Correlat238 Questions
Exam 17: Multiple Regression147 Questions
Exam 18: Review of Statistical Inference189 Questions
Select questions type
Sales and Experience The general manager of a chain of department stores believes that experience is the most important factor in determining the level of success of a salesperson. To examine this belief she records last month's sales (in $1,000s)and the years of experience of 10 randomly selected salespeople. These data are listed below. 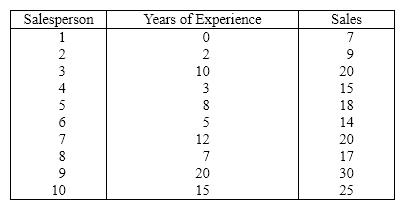 {Sales and Experience Narrative} Do the tests of r and b 1 in the previous two questions provide the same results? Explain.
(Essay)
4.9/5  (29)
(29)
Cost of Textbooks The editor of a higher education book publisher claims that a large part of the cost of books is the cost of paper. This implies that larger textbooks will cost more money. As an experiment to analyze the claim, a university student visits the bookstore and records the number of pages and the selling price of twelve randomly selected textbooks. These data are listed below. 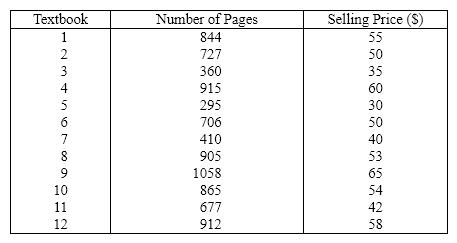 {Cost of Textbooks Narrative} Draw a scatter diagram of the data. Comment on whether it appears that a linear model might be appropriate.
(Essay)
4.8/5 (31)
Given the least squares regression line 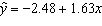 , and a coefficient of determination of 0.81, the coefficient of correlation is:
(Multiple Choice)
4.7/5 (32)
{Trivia Games & Education Narrative} Interpret the value of the slope of the regression line.
(Essay)
4.9/5 (36)
The value of the sum of squares for regression SSR can never be smaller than 1.
(True/False)
4.8/5 (34)
If cov( x , y )= 7.5075 and  , then the sample slope coefficient is 2.145.
(True/False)
4.8/5 (35)
A straight line regression model with only one independent variable is called a(n)____________________-order linear model.
(Short Answer)
4.8/5 (43)
In testing the hypotheses: H 0: b 1 = 0 vs. H 0: b 1 ¹ 0, the following statistics are available:  ,
,  ,
,  ,
,  , and
, and  . The value of the test statistic is:
(Multiple Choice)
4.8/5 (34)
Oil Quality and Price Quality of oil is measured in API gravity degrees--the higher the degrees API, the higher the quality. The table shown below is produced by an expert in the field who believes that there is a relationship between quality and price per barrel.
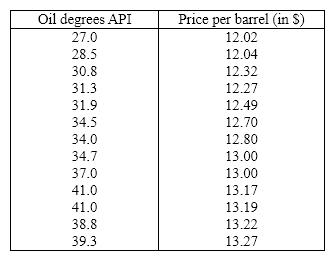 A partial Minitab output follows:
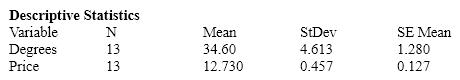


 {Oil Quality and Price Narrative} Estimate with 95% confidence the average oil price per barrel for an API degree of 35.
(Essay)
4.9/5 (41)
Oil Quality and Price Quality of oil is measured in API gravity degrees--the higher the degrees API, the higher the quality. The table shown below is produced by an expert in the field who believes that there is a relationship between quality and price per barrel.  A partial Minitab output follows:

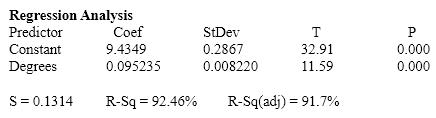
 {Oil Quality and Price Narrative} Estimate with 95% confidence the average oil price per barrel for an API degree of 35.
(Essay)
4.8/5 (34)
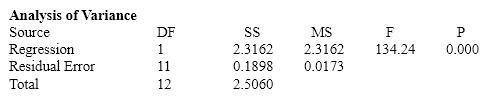
Oil Quality and Price Quality of oil is measured in API gravity degrees--the higher the degrees API, the higher the quality. The table shown below is produced by an expert in the field who believes that there is a positive relationship between quality and price per barrel.  A partial statistical software output follows:
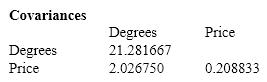
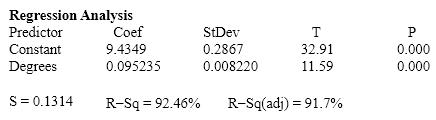
 {Oil Quality and Price Narrative} Determine the coefficient of determination and discuss what its value tells you about the two variables.
(Essay)
4.8/5 (24)
Wayne Newton Concert At a recent Wayne Newton concert, a survey was conducted that asked a random sample of 20 people their age and how many concerts they have attended since the first of the year. The following data were collected: 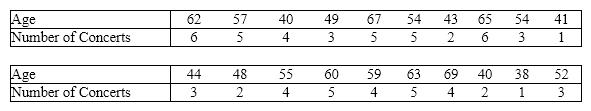 An Excel output follows:
 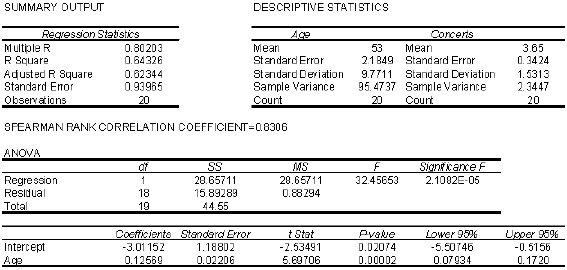 {Wayne Newton Concert Narrative} Predict with 95% confidence the number of concerts attended by a 45 years-old individual.
(Essay)
4.8/5 (42)
You use a(n)____________________ interval whenever you want to estimate the mean of y when x is a given value.
(Short Answer)
4.8/5 (44)
The objective of a regression model is to analyze the relationship between two variables, x and y , both of which must be based on ____________________ data.
(Short Answer)
4.8/5 (46)
Cost of Books The editor of a major academic book publisher claims that a large part of the cost of books is the cost of paper. This implies that larger books will cost more money. As an experiment to analyze the claim, a university student visits the bookstore and records the number of pages and the selling price of twelve randomly selected books. These data are listed below. 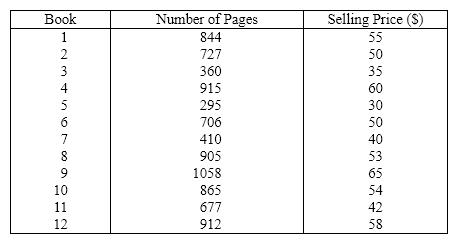 {Cost of Books Narrative} Determine the coefficient of determination and discuss what its value tells you.
(Essay)
4.7/5 (35)
In simple linear regression, the coefficient of correlation r and the least squares estimate b 1 of the population slope b 1:
(Multiple Choice)
4.8/5 (39)
The method of least squares requires that the sum of the squared deviations between actual y values in the scatter diagram and y values predicted by the regression line be minimized.
(True/False)
4.8/5 (32)
If the error variable e is normally distributed, the test statistic for testing H 0: b 1 = 0 has a Student t -distribution with n - 2 degrees of freedom.
(True/False)
4.9/5 (38)
In order to predict with 80% confidence the expected value of y for a given value of x in a simple linear regression problem, a random sample of 15 observations is taken. Which of the following t -table values listed below would be used?
(Multiple Choice)
4.7/5 (45)
The following 10 observations of variables x and y were collected.  a. Calculate the standard error of estimate.
b. Test to determine if there is enough evidence at the 5% significance level to indicate that x and y are negatively linearly related.
c. Calculate the coefficient of correlation, and describe what this statistic tells you about the regression line.
a. Calculate the standard error of estimate.
b. Test to determine if there is enough evidence at the 5% significance level to indicate that x and y are negatively linearly related.
c. Calculate the coefficient of correlation, and describe what this statistic tells you about the regression line.
(Essay)
4.8/5 (38)
Filters
- Essay(0)
- Multiple Choice(0)
- Short Answer(0)
- True False(0)
- Matching(0)