Exam 16: Simple Linear Regression and Correlat
Exam 1: What Is Statistics41 Questions
Exam 2: Graphical and Tabular Descriptive Techniques199 Questions
Exam 3: Numerical Descriptive Techniques226 Questions
Exam 4: Data Collection and Sampling82 Questions
Exam 5: Probability212 Questions
Exam 6: Random Variables and Discrete Probability Distributions174 Questions
Exam 7: Continuous Probability Distributions167 Questions
Exam 8: Sampling Distributions133 Questions
Exam 9: Introduction to Estimation88 Questions
Exam 10: Introduction to Hypothesis Testing186 Questions
Exam 11: Inference About a Population76 Questions
Exam 12: Inference About Comparing Two Populat85 Questions
Exam 13: Inference About Comparing Two Populat85 Questions
Exam 14: Analysis of Variance127 Questions
Exam 15: Chi-Squared Tests118 Questions
Exam 16: Simple Linear Regression and Correlat238 Questions
Exam 17: Multiple Regression147 Questions
Exam 18: Review of Statistical Inference189 Questions
Select questions type
If an estimated regression line has a y -intercept of 10 and a slope of 4, then when x = 2 the actual value of y is:
(Multiple Choice)
4.8/5  (34)
(34)
A regression analysis between weight ( y in pounds)and height ( x in inches)resulted in the following least squares line:  . This implies that if the height is increased by 1 inch, the weight is expected to increase by an average of 6 pounds.
(True/False)
4.9/5 (27)
A prediction interval is used when we want to predict a one-time occurrence for a particular value of y when the independent variable is a given x value.
(True/False)
4.9/5 (40)
A regression analysis between sales (in $)and advertising (in $)resulted in the following least squares line:  . This implies that an increase of $1 in advertising is associated with an increase of $60 in sales.
(True/False)
4.8/5 (29)
Game Show Winnings & Education An ardent fan of television game shows has observed that, in general, the more educated the contestant, the less money he or she wins. To test her belief she gathers data about the last eight winners of her favorite game show. She records their winnings in dollars and the number of years of education. The results are as follows. 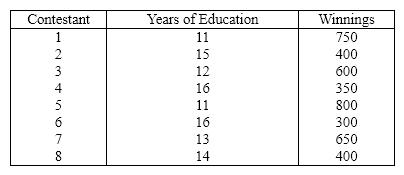 {Game Show Winnings & Education Narrative} Determine the standard error of estimate and describe what this statistic tells you about the regression line.
(Essay)
4.9/5 (37)
Income and Education A professor of economics wants to study the relationship between income ( y in $1000s)and education ( x in years). A random sample eight individuals is taken and the results are shown below. 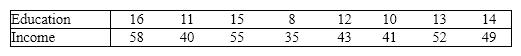 {Income and Education Narrative} Estimate the income of an individual with 15 years of education.
(Essay)
4.9/5 (27)
Rock Concert Revenues A financier whose specialty is investing in rock concerts has observed that, in general, concerts with "big-name" stars seem to generate more revenue than those concerts whose stars are less well known. To examine his belief he records the gross revenue and the payment (in $ millions)given to the two highest-paid performers in the concert for ten concert tours. 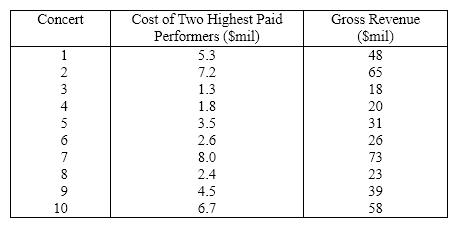 {Rock Concert Revenues Narrative} Do the r and b 1 tests in the previous questions provide the same results? Explain.
(Essay)
4.8/5 (36)
The deviations between the actual data points and the fitted values from the model are called ____________________.
(Short Answer)
4.8/5 (39)
If cov( x, y )= 1260,  , and
, and  , then the coefficient of determination is:
(Multiple Choice)
4.7/5 (36)
Sales and Experience The general manager of a chain of department stores believes that experience is the most important factor in determining the level of success of a salesperson. To examine this belief she records last month's sales (in $1,000s)and the years of experience of 10 randomly selected salespeople. These data are listed below. 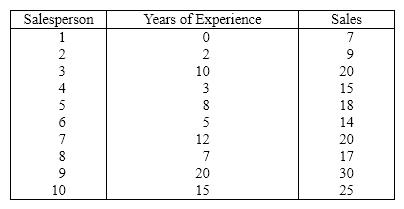 {Sales and Experience Narrative} Determine the standard error of estimate and describe what this statistic tells you about the regression line.
(Essay)
5.0/5 (43)
In regression analysis, if the coefficient of determination is 1.0, then:
(Multiple Choice)
4.8/5 (37)
In a regression problem the following pairs of ( x, y )are given: (3, 1), (3, - 1), (3, 0), (3, - 2)and (3, 2). That indicates that the:
(Multiple Choice)
5.0/5 (27)
If the coefficient of correlation is 0.90, then the percentage of the variation in the dependent variable y that is explained by the variation in the independent variable x is:
(Multiple Choice)
4.9/5 (35)
Car Speed and Gas Mileage An economist wanted to analyze the relationship between the speed of a car ( x )and its gas mileage ( y ). As an experiment a car is operated at several different speeds and for each speed the gas mileage is measured. These data are shown below.
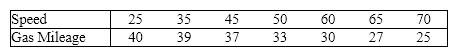 {Car Speed and Gas Mileage Narrative} What does the coefficient of correlation tell you about the direction and strength of the relationship between the two variables?
(Essay)
4.8/5 (31)
The confidence interval estimate of the expected value of y will be narrower than the prediction interval for the same given value of x and confidence level. This is because there is less error in estimating a mean value as opposed to predicting an individual value.
(True/False)
4.8/5 (35)
UV's and Skin Cancer A medical statistician wanted to examine the relationship between the amount of UV's ( x )and incidence of skin cancer ( y ). As an experiment he found the number of skin cancers detected per 100,000 of population and the average daily sunshine in eight states around the country. These data are shown below.  {UV's and Skin Cancer Narrative} Calculate the Pearson coefficient. What sign does it have? Why?
(Essay)
4.8/5 (30)
In simple linear regression, which of the following statements indicates there is no linear relationship between the variables x and y ?
(Multiple Choice)
4.9/5 (38)
A regression analysis between sales (in $1,000)and advertising (in $1,000)resulted in the following least squares line:  . This implies that:
(Multiple Choice)
4.9/5 (36)
For a regression analysis to be valid, the value of the error variable associated with any particular value of y is ____________________ of the value of the error variable associated with any other value of y .
(Short Answer)
4.9/5 (44)
Filters
- Essay(0)
- Multiple Choice(0)
- Short Answer(0)
- True False(0)
- Matching(0)