Exam 16: Simple Linear Regression and Correlat
Exam 1: What Is Statistics41 Questions
Exam 2: Graphical and Tabular Descriptive Techniques199 Questions
Exam 3: Numerical Descriptive Techniques226 Questions
Exam 4: Data Collection and Sampling82 Questions
Exam 5: Probability212 Questions
Exam 6: Random Variables and Discrete Probability Distributions174 Questions
Exam 7: Continuous Probability Distributions167 Questions
Exam 8: Sampling Distributions133 Questions
Exam 9: Introduction to Estimation88 Questions
Exam 10: Introduction to Hypothesis Testing186 Questions
Exam 11: Inference About a Population76 Questions
Exam 12: Inference About Comparing Two Populat85 Questions
Exam 13: Inference About Comparing Two Populat85 Questions
Exam 14: Analysis of Variance127 Questions
Exam 15: Chi-Squared Tests118 Questions
Exam 16: Simple Linear Regression and Correlat238 Questions
Exam 17: Multiple Regression147 Questions
Exam 18: Review of Statistical Inference189 Questions
Select questions type
A regression analysis between weight ( y in pounds)and height ( x in inches)resulted in the following least squares line:  . This implies that if the height is increased by 1 inch, the weight, on average, is expected to:
(Multiple Choice)
4.9/5  (32)
(32)
If the coefficient of correlation is 1.0, then the coefficient of determination must be 1.0.
(True/False)
4.9/5 (30)
Oil Quality and Price Quality of oil is measured in API gravity degrees--the higher the degrees API, the higher the quality. The table shown below is produced by an expert in the field who believes that there is a positive relationship between quality and price per barrel. 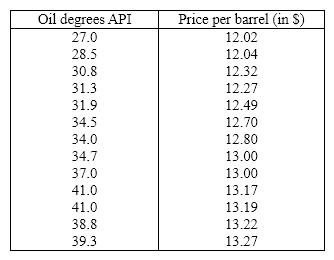 A partial statistical software output follows:
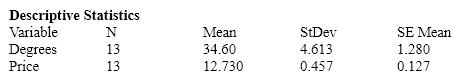
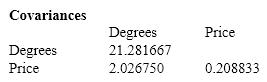
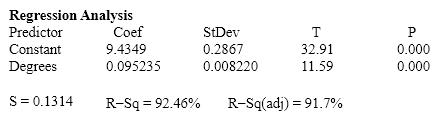
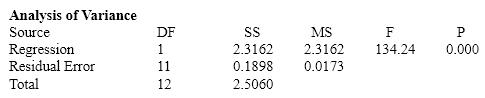 {Oil Quality and Price Narrative} Conduct a test of the population coefficient of correlation to determine at the 5% significance level whether a positive linear relationship exists between the quality of oil and price per barrel.
(Essay)
4.8/5 (38)
A prediction interval for a particular y is always ____________________ than a confidence interval for the mean of y .
(Short Answer)
4.8/5 (42)
UV's and Skin Cancer A medical statistician wanted to examine the relationship between the amount of UV's ( x )and incidence of skin cancer ( y ). As an experiment he found the number of skin cancers detected per 100,000 of population and the average daily sunshine in eight states around the country. These data are shown below.  {UV's and Skin Cancer Narrative} Calculate the standard error of estimate, and describe what this statistic tells you about the regression line.
(Essay)
4.8/5 (39)
If all the points in a scatter diagram lie on the least squares regression line, then the coefficient of correlation must be:
(Multiple Choice)
4.9/5 (36)
The graph of a confidence interval for the expected value of y is represented by two parallel lines, one on either side of the regression line.
(True/False)
5.0/5 (33)
The point where confidence intervals and prediction intervals do best is  .
.
(True/False)
4.9/5 (33)
In a simple linear regression problem, the following sum of squares are produced: 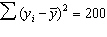 ,
, 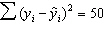 , and
, and 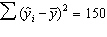 . The percentage of the variation in y that is explained by the variation in x is:
(Multiple Choice)
4.8/5 (30)
The Pearson coefficient of correlation r equals one when there is no:
(Multiple Choice)
4.9/5 (41)
Income and Education A professor of economics wants to study the relationship between income ( y in $1000s)and education ( x in years). A random sample eight individuals is taken and the results are shown below. 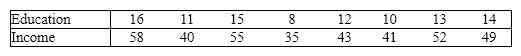 {Income and Education Narrative} Determine the least squares regression line.
(Essay)
4.7/5 (34)
In the simple linear regression model, the slope represents the:
(Multiple Choice)
4.7/5 (32)
In the first-order linear regression model, the population parameters of the y -intercept and the slope are, respectively,
(Multiple Choice)
4.7/5 (43)
Sales and Experience The general manager of a chain of department stores believes that experience is the most important factor in determining the level of success of a salesperson. To examine this belief she records last month's sales (in $1,000s)and the years of experience of 10 randomly selected salespeople. These data are listed below. 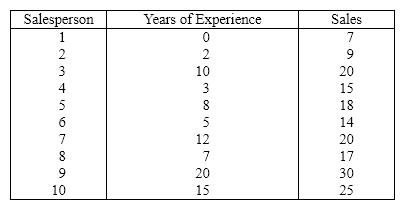 {Sales and Experience Narrative} Estimate the monthly sales for a salesperson with 16 years of experience.
(Essay)
4.8/5 (42)
If the coefficient of determination is 0.95, this means that 95% of the y values were predicted correctly by the regression line.
(True/False)
5.0/5 (27)
The smallest value that the standard error of estimate s e can assume is:
(Multiple Choice)
4.9/5 (35)
Wayne Newton Concert At a recent Wayne Newton concert, a survey was conducted that asked a random sample of 20 people their age and how many concerts they have attended since the first of the year. The following data were collected: 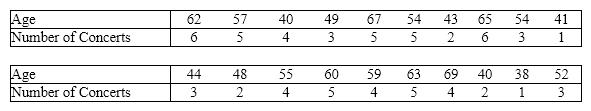 An Excel output follows:
 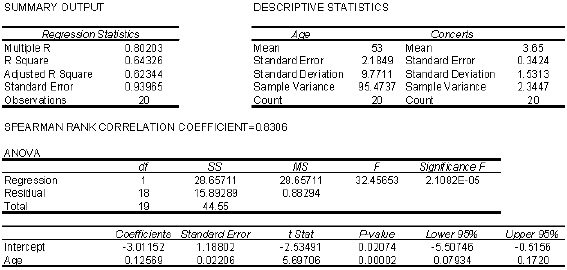 {Wayne Newton Concert Narrative} Which interval in the previous two questions is narrower: the confidence interval estimate of the expected value of y or the prediction interval for the same given value of x (10 years)and same confidence level? Why?
(Essay)
4.8/5 (40)
When the actual values y of a dependent variable and the corresponding predicted values  are the same, the standard error of estimate s e will be 0.0.
(True/False)
4.9/5 (28)
Filters
- Essay(0)
- Multiple Choice(0)
- Short Answer(0)
- True False(0)
- Matching(0)