Exam 16: Simple Linear Regression and Correlat
Exam 1: What Is Statistics41 Questions
Exam 2: Graphical and Tabular Descriptive Techniques199 Questions
Exam 3: Numerical Descriptive Techniques226 Questions
Exam 4: Data Collection and Sampling82 Questions
Exam 5: Probability212 Questions
Exam 6: Random Variables and Discrete Probability Distributions174 Questions
Exam 7: Continuous Probability Distributions167 Questions
Exam 8: Sampling Distributions133 Questions
Exam 9: Introduction to Estimation88 Questions
Exam 10: Introduction to Hypothesis Testing186 Questions
Exam 11: Inference About a Population76 Questions
Exam 12: Inference About Comparing Two Populat85 Questions
Exam 13: Inference About Comparing Two Populat85 Questions
Exam 14: Analysis of Variance127 Questions
Exam 15: Chi-Squared Tests118 Questions
Exam 16: Simple Linear Regression and Correlat238 Questions
Exam 17: Multiple Regression147 Questions
Exam 18: Review of Statistical Inference189 Questions
Select questions type
Allman Brothers Concert At a recent Allman Brothers concert, a survey was conducted that asked a random sample of 20 people their age and how many concerts they have attended since the first of the year. The following data were collected: 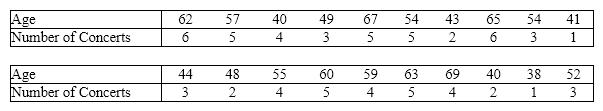 An Excel output follows:
 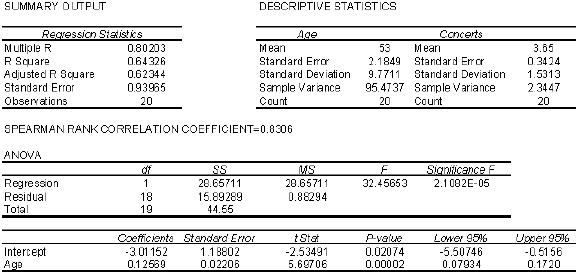 {Allman Brothers Concert Narrative} Draw a scatter diagram of the data. Comment on whether it appears that a linear model might be appropriate to describe the relationship between the age and number of concerts attended by the respondents.
(Essay)
4.8/5  (32)
(32)
The regression line  has been fitted to the data points (4, 8), (2, 5), and (1, 2). The sum of the squared residuals will be:
(Multiple Choice)
4.8/5 (39)
If the coefficient of correlation is - 0.80, then the percentage of the variation in y that is explained by the variation in x is:
(Multiple Choice)
4.8/5 (37)
Testing whether the slope of the population regression line could be zero is equivalent to testing whether the:
(Multiple Choice)
4.9/5 (33)
Cost of Textbooks The editor of a higher education book publisher claims that a large part of the cost of books is the cost of paper. This implies that larger textbooks will cost more money. As an experiment to analyze the claim, a university student visits the bookstore and records the number of pages and the selling price of twelve randomly selected textbooks. These data are listed below. 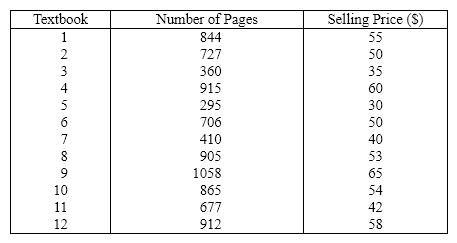 {Cost of Textbooks Narrative} Estimate the selling price for a 650 pages book.
(Essay)
4.9/5 (37)
Trivia Games & Education An ardent fan of television game shows has observed that, in general, the more educated the contestant, the less money he or she wins. To test her belief she gathers data about the last eight winners of her favorite game show. She records their winnings in dollars and the number of years of education. The results are as follows. 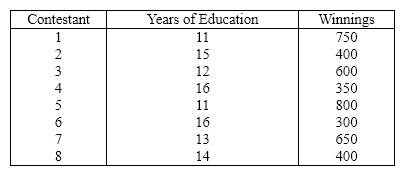 {Trivia Games & Education Narrative} Draw a scatter diagram of the data. Comment on whether it appears that a linear model might be appropriate.
(Essay)
4.9/5 (25)
A regression analysis between sales (in $1000)and advertising (in $100)resulted in the following least squares line:  . This implies that if advertising is $600, then the predicted amount of sales (in dollars)is $125,000.
(True/False)
4.7/5 (35)
If we are interested in determining whether two variables are linearly related, it is necessary to:
(Multiple Choice)
4.9/5 (38)
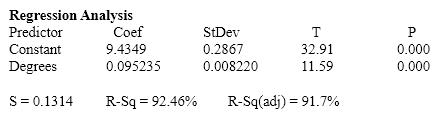
Oil Quality and Price Quality of oil is measured in API gravity degrees--the higher the degrees API, the higher the quality. The table shown below is produced by an expert in the field who believes that there is a relationship between quality and price per barrel.  A partial Minitab output follows:

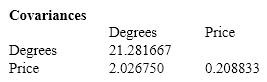

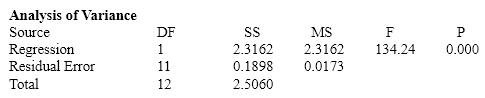 {Oil Quality and Price Narrative} Interpret the value of the slope of the regression line.
(Essay)
4.7/5 (33)
Accidents and Rain A statistician investigating the relationship between the amount of rain (in inches)and the number of automobile accidents gathered data on accidents in her city for 10 randomly selected days throughout the year. The results are shown below. 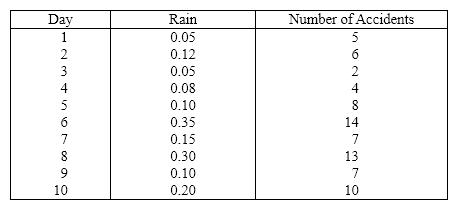 {Accidents and Rain Narrative} What other variables might be associated with accidents, besides or along with rain?
(Essay)
4.9/5 (34)
When the actual values y of a dependent variable and the corresponding predicted values  are the same, the standard error of the estimate will be 1.0.
(True/False)
4.8/5 (26)
The width of the confidence interval estimate for the predicted value of y depends on
(Multiple Choice)
4.8/5 (41)
Sunshine and Melanoma A medical researcher wanted to examine the relationship between the amount of sunshine ( x )in hours, and incidence of melanoma, a type of skin cancer ( y ). As an experiment he found the number of melanoma cases detected per 100,000 of population and the average daily sunshine in eight counties around the country. These data are shown below.  {Sunshine and Melanoma Narrative} Calculate the residual corresponding to the pair ( x , y )= (8, 15).
(Essay)
4.7/5 (29)
Given that the sum of squares for error is 60 and the sum of squares for regression is 140, then the coefficient of determination is:
(Multiple Choice)
4.8/5 (47)
If there is no linear relationship between two variables x and y , the coefficient of determination must be - 1.0.
(True/False)
4.7/5 (39)
Theatre Revenues A financier whose specialty is investing in stage productions has observed that, in general, movies with "big-name" stars seem to generate more revenue than those plays whose stars are less well known. To examine his belief he records the gross revenue and the payment (in $ millions)given to the two highest-paid performers in the play for ten recently staged plays. 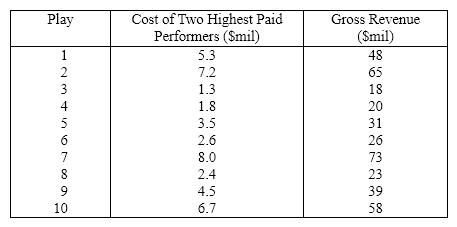 {Theatre Revenues Narrative} Estimate the gross revenue of a play if the two highest paid performers received 6 million dollars.
(Essay)
4.7/5 (41)
Oil Quality and Price Quality of oil is measured in API gravity degrees--the higher the degrees API, the higher the quality. The table shown below is produced by an expert in the field who believes that there is a relationship between quality and price per barrel. 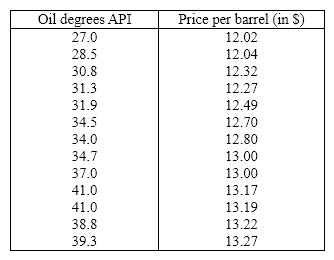 A partial Minitab output follows:
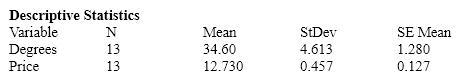

 {Oil Quality and Price Narrative} Draw a scatter diagram of the data. Comment on whether it appears that a linear model might be appropriate to describe the relationship between the quality of oil and price per barrel.
(Essay)
5.0/5 (35)
Truck Speed vs Gas Mileage An economist wanted to analyze the relationship between the speed of a car ( x )and its gas mileage ( y ). As an experiment a car is operated at several different speeds and for each speed the gas mileage is measured. These data are shown below. 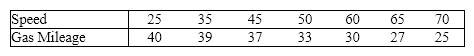 {Truck Speed vs Gas Mileage Narrative} Estimate the gas mileage of a car traveling 70 mph.
(Essay)
4.9/5 (34)
Filters
- Essay(0)
- Multiple Choice(0)
- Short Answer(0)
- True False(0)
- Matching(0)