Exam 16: Simple Linear Regression and Correlat
Exam 1: What Is Statistics41 Questions
Exam 2: Graphical and Tabular Descriptive Techniques199 Questions
Exam 3: Numerical Descriptive Techniques226 Questions
Exam 4: Data Collection and Sampling82 Questions
Exam 5: Probability212 Questions
Exam 6: Random Variables and Discrete Probability Distributions174 Questions
Exam 7: Continuous Probability Distributions167 Questions
Exam 8: Sampling Distributions133 Questions
Exam 9: Introduction to Estimation88 Questions
Exam 10: Introduction to Hypothesis Testing186 Questions
Exam 11: Inference About a Population76 Questions
Exam 12: Inference About Comparing Two Populat85 Questions
Exam 13: Inference About Comparing Two Populat85 Questions
Exam 14: Analysis of Variance127 Questions
Exam 15: Chi-Squared Tests118 Questions
Exam 16: Simple Linear Regression and Correlat238 Questions
Exam 17: Multiple Regression147 Questions
Exam 18: Review of Statistical Inference189 Questions
Select questions type
In order to predict with 98% confidence the expected value of y for a given value of x in a simple linear regression problem, a random sample of 15 observations is taken. Which of the following t -table values listed below would be used?
(Multiple Choice)
4.9/5  (40)
(40)
Sales and Experience The general manager of a chain of department stores believes that experience is the most important factor in determining the level of success of a salesperson. To examine this belief she records last month's sales (in $1,000s)and the years of experience of 10 randomly selected salespeople. These data are listed below. 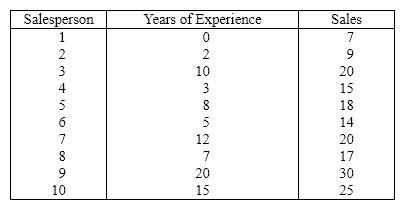 {Sales and Experience Narrative} Conduct a test of the population slope to determine at the 5% significance level whether a positive linear relationship exists between years of experience and sales.
(Essay)
4.9/5 (37)
Sunshine and Melanoma A medical researcher wanted to examine the relationship between the amount of sunshine ( x )in hours, and incidence of melanoma, a type of skin cancer ( y ). As an experiment he found the number of melanoma cases detected per 100,000 of population and the average daily sunshine in eight counties around the country. These data are shown below.  {Sunshine and Melanoma Narrative} Estimate the number of skin cancer cases per 100,000 people who live in a state that gets 6 hours of sunshine on average.
(Essay)
4.8/5 (29)
Theatre Revenues A financier whose specialty is investing in stage productions has observed that, in general, movies with "big-name" stars seem to generate more revenue than those plays whose stars are less well known. To examine his belief he records the gross revenue and the payment (in $ millions)given to the two highest-paid performers in the play for ten recently staged plays.  {Theatre Revenues Narrative} Are the two highest paid performers worth all the money paid for them? Comment using the statistical analyses you have done.
(Essay)
4.9/5 (39)
The following 10 observations of variables x and y were collected. 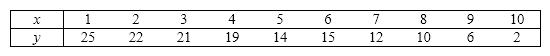 Find the least squares regression line, and the estimated value of y when x = 3.
(Essay)
4.9/5 (37)
Game Winnings & Education An ardent fan of television game shows has observed that, in general, the more educated the contestant, the less money he or she wins. To test her belief she gathers data about the last eight winners of her favorite game show. She records their winnings in dollars and the number of years of education. The results are as follows. 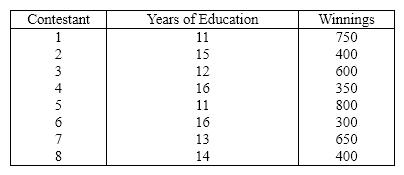 {Game Winnings & Education Narrative} Estimate with 95% confidence the average winnings of all contestants who have 15 years of education.
(Essay)
4.8/5 (31)
UV's and Skin Cancer A medical statistician wanted to examine the relationship between the amount of UV's ( x )and incidence of skin cancer ( y ). As an experiment he found the number of skin cancers detected per 100,000 of population and the average daily sunshine in eight states around the country. These data are shown below.  {UV's and Skin Cancer Narrative} Calculate the Pearson coefficient. What sign does it have? Why?
(Essay)
4.7/5 (37)
The unbiased estimator of the variance of the error variable is found by taking ____________________ divided by n - 2.
(Short Answer)
4.9/5 (37)
Cost of Textbooks The editor of a higher education book publisher claims that a large part of the cost of books is the cost of paper. This implies that larger textbooks will cost more money. As an experiment to analyze the claim, a university student visits the bookstore and records the number of pages and the selling price of twelve randomly selected textbooks. These data are listed below.
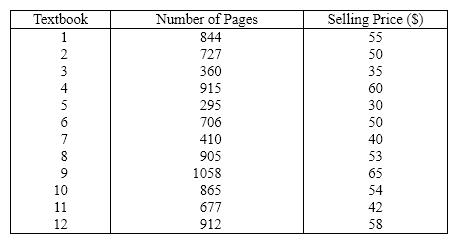 {Cost of Textbooks Narrative} Estimate the selling price for a 650 pages book.
(Essay)
5.0/5 (37)
In a regression problem, if the coefficient of determination is 0.95, this means that:
(Multiple Choice)
4.9/5 (44)
Theatre Revenues A financier whose specialty is investing in stage productions has observed that, in general, movies with "big-name" stars seem to generate more revenue than those plays whose stars are less well known. To examine his belief he records the gross revenue and the payment (in $ millions)given to the two highest-paid performers in the play for ten recently staged plays. 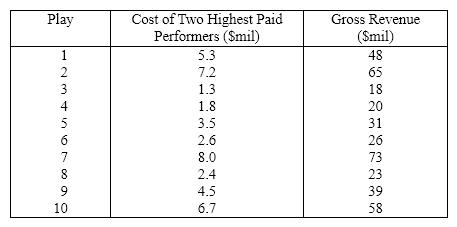 {Theatre Revenues Narrative} Draw a scatter diagram of the data. Comment on whether it appears that a linear model might be appropriate.
(Essay)
4.9/5 (25)
If the regression line is horizontal, the slope is ____________________ and x and y are not related.
(Short Answer)
4.9/5 (35)
A direct relationship between an independent variable x and a dependent variably y means that the variables x and y increase or decrease together.
(True/False)
4.8/5 (38)
Car Speed and Gas Mileage An economist wanted to analyze the relationship between the speed of a car ( x )and its gas mileage ( y ). As an experiment a car is operated at several different speeds and for each speed the gas mileage is measured. These data are shown below. 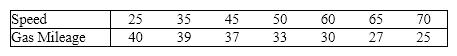 {Car Speed and Gas Mileage Narrative} Does this data provide sufficient evidence at the 5% significance level to infer that a linear relationship exists between speed and gas mileage?
(Essay)
4.9/5 (32)
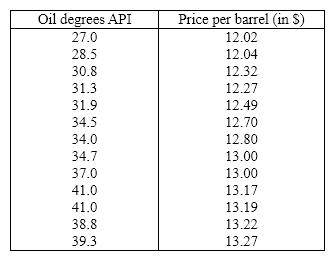
Oil Quality and Price Quality of oil is measured in API gravity degrees--the higher the degrees API, the higher the quality. The table shown below is produced by an expert in the field who believes that there is a positive relationship between quality and price per barrel.
 A partial statistical software output follows:
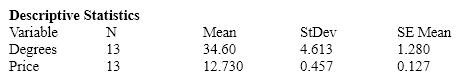


 {Oil Quality and Price Narrative} Do the r and b 1 tests in the previous two questions provide the same results? Explain.
(Essay)
4.8/5 (26)
{Trivia Games & Education Narrative} Determine the least squares regression line.
(Essay)
4.9/5 (45)
Oil Quality and Price Quality of oil is measured in API gravity degrees--the higher the degrees API, the higher the quality. The table shown below is produced by an expert in the field who believes that there is a positive relationship between quality and price per barrel.  A partial statistical software output follows:

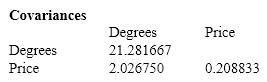
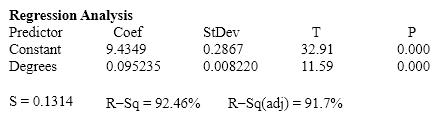
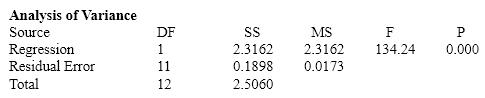 {Oil Quality and Price Narrative} Calculate the Pearson correlation coefficient. What sign does it have? Why?
(Essay)
4.7/5 (32)
Car Speed and Gas Mileage An economist wanted to analyze the relationship between the speed of a car ( x )and its gas mileage ( y ). As an experiment a car is operated at several different speeds and for each speed the gas mileage is measured. These data are shown below.  {Car Speed and Gas Mileage Narrative} Calculate the standard error of estimate, and describe what this statistic tells you about the regression line.
(Essay)
4.9/5 (37)
A zero correlation coefficient between a pair of random variables means that there is no linear relationship between the random variables.
(True/False)
4.8/5 (30)
Filters
- Essay(0)
- Multiple Choice(0)
- Short Answer(0)
- True False(0)
- Matching(0)