Exam 16: Simple Linear Regression and Correlat
Exam 1: What Is Statistics41 Questions
Exam 2: Graphical and Tabular Descriptive Techniques199 Questions
Exam 3: Numerical Descriptive Techniques226 Questions
Exam 4: Data Collection and Sampling82 Questions
Exam 5: Probability212 Questions
Exam 6: Random Variables and Discrete Probability Distributions174 Questions
Exam 7: Continuous Probability Distributions167 Questions
Exam 8: Sampling Distributions133 Questions
Exam 9: Introduction to Estimation88 Questions
Exam 10: Introduction to Hypothesis Testing186 Questions
Exam 11: Inference About a Population76 Questions
Exam 12: Inference About Comparing Two Populat85 Questions
Exam 13: Inference About Comparing Two Populat85 Questions
Exam 14: Analysis of Variance127 Questions
Exam 15: Chi-Squared Tests118 Questions
Exam 16: Simple Linear Regression and Correlat238 Questions
Exam 17: Multiple Regression147 Questions
Exam 18: Review of Statistical Inference189 Questions
Select questions type
The regression line  has been fitted to the data points (4, 11), (2, 7), and (1, 5). The sum of squares for error will be 10.0.
(True/False)
4.8/5  (33)
(33)
Car Speed and Gas Mileage An economist wanted to analyze the relationship between the speed of a car ( x )and its gas mileage ( y ). As an experiment a car is operated at several different speeds and for each speed the gas mileage is measured. These data are shown below.  {Car Speed and Gas Mileage Narrative} Calculate the Pearson coefficient of correlation.
(Essay)
4.9/5 (42)
An inverse relationship between an independent variable x and a dependent variably y means that as x increases, y decreases, and vice versa.
(True/False)
4.8/5 (27)
Another name for the residual term in a regression equation is random error.
(True/False)
4.8/5 (34)
The residuals are observations of the error variable e . Consequently, the minimized sum of squared deviations is called the sum of squares for error, denoted SSE.
(True/False)
4.8/5 (38)
If the coefficient of correlation is - 0.60, then the coefficient of determination is:
(Multiple Choice)
4.8/5 (38)
The symbol for the population coefficient of correlation is:
(Multiple Choice)
4.9/5 (39)
In a simple linear regression problem, the following statistics are calculated from a sample of 10 observations: 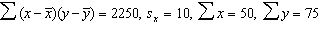 . The least squares estimates of the slope and y -intercept are, respectively,
(Multiple Choice)
4.9/5 (39)
Game Show Winnings & Education An ardent fan of television game shows has observed that, in general, the more educated the contestant, the less money he or she wins. To test her belief she gathers data about the last eight winners of her favorite game show. She records their winnings in dollars and the number of years of education. The results are as follows. 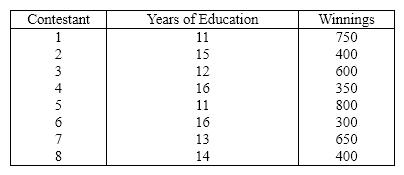 {Game Show Winnings & Education Narrative} Determine the coefficient of determination and discuss what its value tells you about the two variables.
(Essay)
4.9/5 (40)
Statisticians have shown that sample y -intercept b 0 and sample slope coefficient b 1 are unbiased estimators of the population regression parameters b 0 and b 1, respectively.
(True/False)
5.0/5 (33)
UV's and Skin Cancer A medical statistician wanted to examine the relationship between the amount of UV's ( x )and incidence of skin cancer ( y ). As an experiment he found the number of skin cancers detected per 100,000 of population and the average daily sunshine in eight states around the country. These data are shown below.  {UV's and Skin Cancer Narrative} Can we conclude at the 1% significance level that there is a linear relationship between sunshine and skin cancer?
(Essay)
4.9/5 (37)
Graphically, a prediction interval is represented as two ____________________ lines.
(Short Answer)
4.8/5 (29)
The sample correlation coefficient between x and y is 0.375. It has been found out that the p -value is 0.256 when testing H 0: r = 0 against the two-sided alternative H 1: r ¹ 0. To test H 0: r = 0 against the one-sided alternative H 1: r > 0 at a significant level of 0.193, the p- value will be equal to
(Multiple Choice)
4.8/5 (38)
A confidence interval (as opposed to a prediction interval)is used to estimate the long-run average value of y .
(True/False)
4.9/5 (44)
Which of the following statistics and procedures can be used to determine whether a linear model should be employed?
(Multiple Choice)
4.8/5 (30)
Car Speed and Gas Mileage An economist wanted to analyze the relationship between the speed of a car ( x )and its gas mileage ( y ). As an experiment a car is operated at several different speeds and for each speed the gas mileage is measured. These data are shown below. 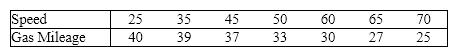 {Car Speed and Gas Mileage Narrative} Calculate the coefficient of determination and interpret its value.
(Essay)
4.9/5 (40)
Sales and Experience The general manager of a chain of hardware stores believes that experience is the most important factor in determining the level of success of a salesperson. To examine this belief she records last month's sales (in $1,000s)and the years of experience of 10 randomly selected salespeople. These data are listed below. 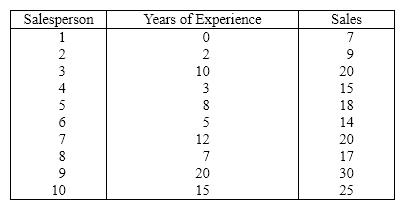 {Sales and Experience Narrative} Determine the standard error of estimate and describe what this statistic tells you about the regression line.
(Essay)
4.7/5 (37)
Filters
- Essay(0)
- Multiple Choice(0)
- Short Answer(0)
- True False(0)
- Matching(0)