Exam 16: Simple Linear Regression and Correlat
Exam 1: What Is Statistics41 Questions
Exam 2: Graphical and Tabular Descriptive Techniques199 Questions
Exam 3: Numerical Descriptive Techniques226 Questions
Exam 4: Data Collection and Sampling82 Questions
Exam 5: Probability212 Questions
Exam 6: Random Variables and Discrete Probability Distributions174 Questions
Exam 7: Continuous Probability Distributions167 Questions
Exam 8: Sampling Distributions133 Questions
Exam 9: Introduction to Estimation88 Questions
Exam 10: Introduction to Hypothesis Testing186 Questions
Exam 11: Inference About a Population76 Questions
Exam 12: Inference About Comparing Two Populat85 Questions
Exam 13: Inference About Comparing Two Populat85 Questions
Exam 14: Analysis of Variance127 Questions
Exam 15: Chi-Squared Tests118 Questions
Exam 16: Simple Linear Regression and Correlat238 Questions
Exam 17: Multiple Regression147 Questions
Exam 18: Review of Statistical Inference189 Questions
Select questions type
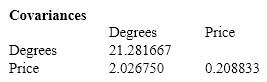
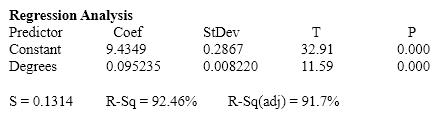
Oil Quality and Price Quality of oil is measured in API gravity degrees--the higher the degrees API, the higher the quality. The table shown below is produced by an expert in the field who believes that there is a relationship between quality and price per barrel. 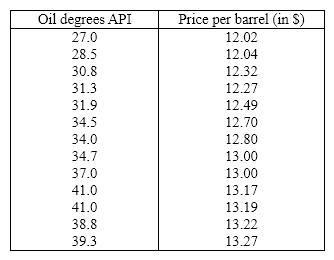 A partial Minitab output follows:
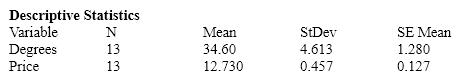
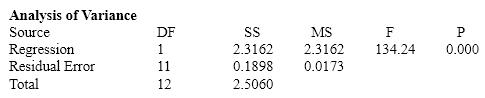 {Oil Quality and Price Narrative} For what values of API gravity degrees do we feel comfortable making predictions for oil price?
(Essay)
4.7/5  (37)
(37)
A zero population correlation coefficient for x and y means that there is no type of relationship whatsoever between x and y.
(True/False)
4.7/5 (36)
Consider the following data values of variables x and y . 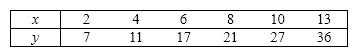 a. Calculate the coefficient of determination, and describe what this statistic tells you about the relationship between the two variables.
b. Calculate the Pearson coefficient of correlation. What sign does it have? Why?
c. What does the coefficient of correlation calculated tell you about the direction and strength of the relationship between the two variables?
a. Calculate the coefficient of determination, and describe what this statistic tells you about the relationship between the two variables.
b. Calculate the Pearson coefficient of correlation. What sign does it have? Why?
c. What does the coefficient of correlation calculated tell you about the direction and strength of the relationship between the two variables?
(Essay)
4.9/5 (31)
If the regression line is horizontal, then we conclude that y ____________________ (is\is not)related to x .
(Short Answer)
4.9/5 (35)
A regression line using 25 observations produced SSR = 118.68 and SSE = 56.32. The standard error of estimate was:
(Multiple Choice)
4.8/5 (33)
If the standard error of estimate s e = 20 and n = 10, then the sum of squares for error, SSE, is:
(Multiple Choice)
4.7/5 (41)
In a simple linear regression model b 0 is the ____________________ of the straight line.
(Short Answer)
4.8/5 (39)
Cost of Textbooks The editor of a higher education book publisher claims that a large part of the cost of books is the cost of paper. This implies that larger textbooks will cost more money. As an experiment to analyze the claim, a university student visits the bookstore and records the number of pages and the selling price of twelve randomly selected textbooks. These data are listed below. 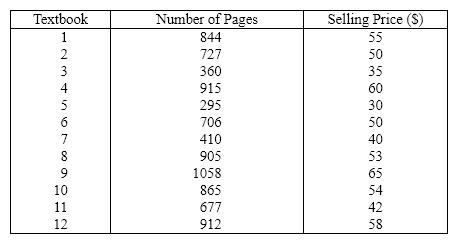 {Cost of Textbooks Narrative} Determine the least squares regression line.
(Essay)
4.8/5 (42)
In performing a regression analysis which of the following must be true about the distribution of the error variable?
(Multiple Choice)
4.7/5 (36)
If the coefficient of correlation is - 0.81, then the percentage of the variation in y that is explained by the regression line is 81%.
(True/False)
4.8/5 (33)
The coefficient of determination is equal to the coefficient of correlation squared.
(True/False)
4.8/5 (30)
Sunshine and Melanoma A medical researcher wanted to examine the relationship between the amount of sunshine ( x )in hours, and incidence of melanoma, a type of skin cancer ( y ). As an experiment he found the number of melanoma cases detected per 100,000 of population and the average daily sunshine in eight counties around the country. These data are shown below.  {Sunshine and Melanoma Narrative} Determine the least squares regression line.
(Essay)
4.8/5 (35)
In regression analysis, you predict the value of one variable on the basis of one or more other related variables. The variable being predicted is called the ____________________ variable, and the related variables used to make the prediction are called ____________________ variables.
(Short Answer)
4.8/5 (33)
Rock Concert Revenues A financier whose specialty is investing in rock concerts has observed that, in general, concerts with "big-name" stars seem to generate more revenue than those concerts whose stars are less well known. To examine his belief he records the gross revenue and the payment (in $ millions)given to the two highest-paid performers in the concert for ten concert tours. 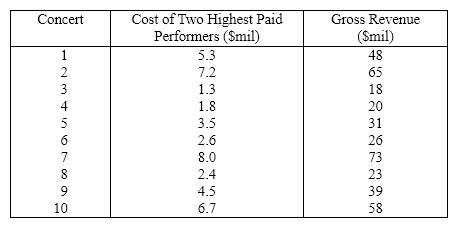 {Rock Concert Revenues Narrative} Conduct a test of the population slope to determine at the 5% significance level whether a positive linear relationship exists between payment to the two highest-paid performers and gross revenue.
(Essay)
4.8/5 (38)
Sales and Experience The general manager of a chain of department stores believes that experience is the most important factor in determining the level of success of a salesperson. To examine this belief she records last month's sales (in $1,000s)and the years of experience of 10 randomly selected salespeople. These data are listed below. 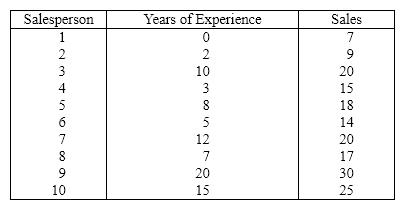 {Sales and Experience Narrative} Interpret the value of the slope of the regression line.
(Essay)
4.8/5 (34)
The vertical spread of the data points about the regression line is measured by the y -intercept.
(True/False)
4.8/5 (42)
Sales and Experience The general manager of a chain of department stores believes that experience is the most important factor in determining the level of success of a salesperson. To examine this belief she records last month's sales (in $1,000s)and the years of experience of 10 randomly selected salespeople. These data are listed below.  {Sales and Experience Narrative} Draw a scatter diagram of the data. Comment on whether it appears that a linear model might be appropriate.
(Essay)
4.9/5 (32)
The degrees of freedom for the test statistic for the slope is ____________________.
(Short Answer)
4.8/5 (39)
Accidents and Rain A statistician investigating the relationship between the amount of rain (in inches)and the number of automobile accidents gathered data on accidents in her city for 10 randomly selected days throughout the year. The results are shown below. 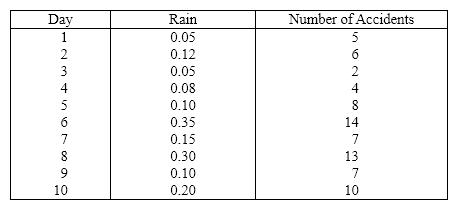 {Accidents and Rain Narrative} Estimate the number of accidents in a day with 0.25 inches of rain.
(Essay)
4.9/5 (40)
Filters
- Essay(0)
- Multiple Choice(0)
- Short Answer(0)
- True False(0)
- Matching(0)