Exam 1: Describing Data: Graphical
Exam 1: Describing Data: Graphical247 Questions
Exam 2: Describing Data: Numerical326 Questions
Exam 3: Probability345 Questions
Exam 4: Discrete Random Variables and Probability Distributions257 Questions
Exam 5: Continuous Random Variables and Probability Distributions239 Questions
Exam 6: Sampling and Sampling Distributions147 Questions
Exam 7: Estimation: Single Population151 Questions
Exam 8: Estimation: Additional Topics109 Questions
Exam 9: Hypothesis Testing: Single Population164 Questions
Exam 10: Hypothesis Testing: Additional Topics103 Questions
Exam 11: Simple Regression217 Questions
Exam 12: Multiple Regression252 Questions
Exam 13: Additional Topics in Regression Analysis168 Questions
Exam 14: Analysis of Categorical Data241 Questions
Exam 15: Analysis of Variance192 Questions
Exam 16: Time-Series Analysis and Forecasting138 Questions
Exam 17: Additional Topics in Sampling110 Questions
Select questions type
400 adults are to be surveyed,what frequencies would you expect to occur for each unwanted item listed on the snapshot?
(Essay)
4.9/5  (35)
(35)
Gender and state of birth are examples of which type of data?
(Multiple Choice)
4.9/5 (29)
The bar chart that best identifies major causes of problems or defects by displaying the frequency of defect causes is called a:
(Multiple Choice)
4.7/5 (38)
A stem-and-leaf is an exploratory data analysis (EDA)graph that is an alternative to the line graph.
(True/False)
5.0/5 (42)
Is it possible for a set of observations to be either a sample or a population? Give an illustrative example.
(Essay)
4.8/5 (38)
Management has given the production line the goal of reducing their defects by 50%.What two defects would you suggest they give special attention to in working toward this goal? Explain.
(Essay)
4.8/5 (40)
The histogram of a sample should have a distribution shape very similar to that of the population from which the sample was drawn.
(True/False)
4.9/5 (49)
Which of the following statements involve descriptive statistics as opposed to inferential statistics?
(Multiple Choice)
4.8/5 (32)
Modify the following statement to reflect possible uncertainty: "The price of GM stock will be lower in six months than it is now."
(Essay)
4.9/5 (40)
Which of the following is an example of a discrete random variable?
(Multiple Choice)
4.8/5 (34)
The ratio scale of measurement indicates both rank and distance from a natural zero.
(True/False)
4.8/5 (35)
THE NEXT QUESTIONS ARE BASED ON THE FOLLOWING INFORMATION:
An investment advisor recently reviewed the account activity of a sample of 10 of his clients and calculated the average number of stock trades per month over the past year for each client.He obtained the following data values: 10.2,2.5,11.4,3.2,1.1,3.4,8.4,9.7,11.2,and 2.4.
-Construct a relative frequency and percent distributions of the data.
(Essay)
4.8/5 (40)
A measurement scale that rates product quality as either 1 = poor,2 = average and 3 = good is known as:
(Multiple Choice)
4.8/5 (35)
A table used to organize data where the left column includes classes or groups and the right column includes the frequencies or observation for each class is called a:
(Multiple Choice)
4.9/5 (41)
The scatter plot can be used to detect whether a linear relationship exists in the data.
(True/False)
4.7/5 (35)
At a large company,the majority of the employees earn from $22,000 to $32,000 per year.Middle management employees earn between $32,000 and $52,000 per year while top management earn between $54,000 and $104,000 per year.A histogram of all salaries would have which of the following shapes?
(Multiple Choice)
4.9/5 (35)
THE NEXT QUESTIONS ARE BASED ON THE FOLLOWING INFORMATION:
The final-inspection defect report for an assembly line is reported on the table and Pareto diagram as shown below:

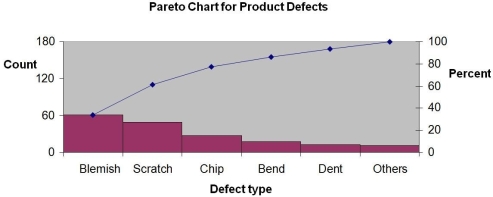 -What is the total defect count in the report?
(Essay)
4.8/5 (33)
Explain the difference between the terms "variable" and "data." Include an illustration that demonstrates this difference.
(Essay)
4.9/5 (36)
Filters
- Essay(0)
- Multiple Choice(0)
- Short Answer(0)
- True False(0)
- Matching(0)