Exam 1: Describing Data: Graphical
Exam 1: Describing Data: Graphical247 Questions
Exam 2: Describing Data: Numerical326 Questions
Exam 3: Probability345 Questions
Exam 4: Discrete Random Variables and Probability Distributions257 Questions
Exam 5: Continuous Random Variables and Probability Distributions239 Questions
Exam 6: Sampling and Sampling Distributions147 Questions
Exam 7: Estimation: Single Population151 Questions
Exam 8: Estimation: Additional Topics109 Questions
Exam 9: Hypothesis Testing: Single Population164 Questions
Exam 10: Hypothesis Testing: Additional Topics103 Questions
Exam 11: Simple Regression217 Questions
Exam 12: Multiple Regression252 Questions
Exam 13: Additional Topics in Regression Analysis168 Questions
Exam 14: Analysis of Categorical Data241 Questions
Exam 15: Analysis of Variance192 Questions
Exam 16: Time-Series Analysis and Forecasting138 Questions
Exam 17: Additional Topics in Sampling110 Questions
Select questions type
Annual university enrollment,annual interest rates,daily stock closing prices for shares,and monthly products sales are examples of which type of data?
(Multiple Choice)
4.7/5  (45)
(45)
A cable company,based on a survey of its customers,reports that 48% of all the television audience watch Larry King Live daily.Is this an example of descriptive or inferential statistics?
(Essay)
4.9/5 (45)
THE NEXT QUESTIONS ARE BASED ON THE FOLLOWING INFORMATION:
Data were collected on the number of people entering an electronics store each hour.The data are presented below.
 -Construct a stem-and-leaf display of the data.
(Essay)
4.8/5 (34)
THE NEXT QUESTIONS ARE BASED ON THE FOLLOWING INFORMATION:
A recent study examined the intended travel destinations for a sample of 100 residents from Grand Rapids,Michigan.The respondents indicated the likely destination of their next vacation.The results of this survey are as follows: 8% were contemplating an international trip,16% were considering Florida,30% said they would go to California,36% thought they would go somewhere within Michigan,and the remaining 10% were looking at some other destination.
-Construct a bar chart to show this information.
(Essay)
4.8/5 (44)
Pareto's principle is applied to a wide variety of behavior over many systems.It is sometimes referred to as the:
(Multiple Choice)
4.8/5 (35)
THE NEXT QUESTIONS ARE BASED ON THE FOLLOWING INFORMATION: 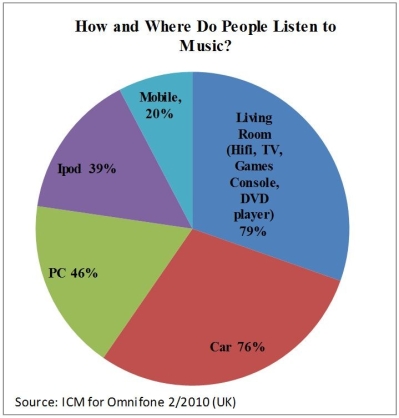 -What percentage of music is listened to on mobile devices?
(Multiple Choice)
4.8/5 (28)
Discuss how a histogram can be constructed to give mistaken impressions and how this error can be corrected.
(Essay)
4.9/5 (41)
A variable within a range of real numbers is referred to as a:
(Multiple Choice)
4.8/5 (38)
Discuss briefly the difference between descriptive and inferential statistics.
(Essay)
4.8/5 (46)
A sample of 30 professional men was asked to estimate their yearly expenditures on clothes for work.The data are summarized in the following stem-and-leaf display. Stem = 100 Leaf = 10 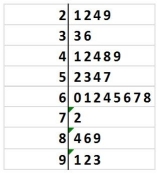 What percentage of these men spent more than $600 and less than $700 on professional attire? (Round to nearest tenth of a percent. )
(Multiple Choice)
4.7/5 (33)
If the distribution of a histogram has more lower values,it is said to be:
(Multiple Choice)
4.9/5 (38)
Which of the following variables is an example of a categorical variable?
(Multiple Choice)
4.9/5 (39)
Descriptive statistics are used to transform information into data.
(True/False)
4.8/5 (32)
An interval scale indicates rank and distance from a natural zero measured in unit intervals.
(True/False)
5.0/5 (32)
What is the best type of chart for comparing two sets of categorical data?
(Multiple Choice)
4.9/5 (26)
THE NEXT QUESTIONS ARE BASED ON THE FOLLOWING INFORMATION:
An investment advisor recently reviewed the account activity of a sample of 10 of his clients and calculated the average number of stock trades per month over the past year for each client.He obtained the following data values: 10.2,2.5,11.4,3.2,1.1,3.4,8.4,9.7,11.2,and 2.4.
-Construct a frequency histogram of the data
(Essay)
4.9/5 (39)
Discrete numerical variables necessarily have a finite number of values.
(True/False)
4.8/5 (35)
Filters
- Essay(0)
- Multiple Choice(0)
- Short Answer(0)
- True False(0)
- Matching(0)