Exam 1: Describing Data: Graphical
Exam 1: Describing Data: Graphical247 Questions
Exam 2: Describing Data: Numerical326 Questions
Exam 3: Probability345 Questions
Exam 4: Discrete Random Variables and Probability Distributions257 Questions
Exam 5: Continuous Random Variables and Probability Distributions239 Questions
Exam 6: Sampling and Sampling Distributions147 Questions
Exam 7: Estimation: Single Population151 Questions
Exam 8: Estimation: Additional Topics109 Questions
Exam 9: Hypothesis Testing: Single Population164 Questions
Exam 10: Hypothesis Testing: Additional Topics103 Questions
Exam 11: Simple Regression217 Questions
Exam 12: Multiple Regression252 Questions
Exam 13: Additional Topics in Regression Analysis168 Questions
Exam 14: Analysis of Categorical Data241 Questions
Exam 15: Analysis of Variance192 Questions
Exam 16: Time-Series Analysis and Forecasting138 Questions
Exam 17: Additional Topics in Sampling110 Questions
Select questions type
THE NEXT QUESTIONS ARE BASED ON THE FOLLOWING INFORMATION:
At New York State University,800 students are randomly selected and asked the distance of their commute to campus.From this group a mean of 14.6 miles is computed.
-What is the parameter?
(Essay)
4.9/5  (39)
(39)
In a simple random sample,every possible sample of size n is equally likely to be selected.
(True/False)
4.9/5 (35)
THE NEXT QUESTIONS ARE BASED ON THE FOLLOWING INFORMATION:
A sample of 150 students at a State University was taken after the final business statistics exam to ask them whether they went partying the weekend before the final or spent the weekend studying,and whether they did well or poorly on the final.The following table contains the result.
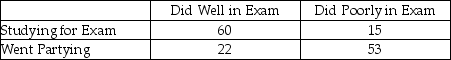 -Of those in the sample who went partying the weekend before the final exam,what percentage of them did well in the exam?
(Essay)
4.8/5 (37)
If we attempt to estimate the average age of a particular university's students using inferential statistics,we are analyzing relationships.
(True/False)
4.7/5 (35)
THE NEXT QUESTIONS ARE BASED ON THE FOLLOWING INFORMATION:
An investment advisor recently reviewed the account activity of a sample of 10 of his clients and calculated the average number of stock trades per month over the past year for each client.He obtained the following data values: 10.2,2.5,11.4,3.2,1.1,3.4,8.4,9.7,11.2,and 2.4.
-Construct a cumulative frequency distribution of the data.
(Essay)
4.7/5 (42)
Simple random sampling is a procedure used to select a sample of a population strictly by chance.
(True/False)
4.7/5 (36)
THE NEXT QUESTIONS ARE BASED ON THE FOLLOWING INFORMATION:
The time (in hours)that a sample of 20 students studied for a statistics test are shown below
 -Construct a relative frequency and percent distributions of the data.
(Essay)
4.9/5 (48)
THE NEXT QUESTIONS ARE BASED ON THE FOLLOWING INFORMATION:
The time (in hours)that a sample of 20 students studied for a statistics test are shown below
-Construct a frequency histogram to describe graphically the time (in hours)that students studied for the test
(Essay)
4.7/5 (38)
A summary measure that is computed from a population is known as a(n):
(Multiple Choice)
4.7/5 (44)
Consider the following data: like,no preference,or dislike.Which of the following best describes these data?
(Multiple Choice)
4.8/5 (37)
A source of error resulting from the fact that information is available only on a subset of the total population is referred to as a(n):
(Multiple Choice)
4.8/5 (33)
If we attempt to determine if weekend sales are higher than weekday sales using inferential statistics,we are testing a hypothesis.
(True/False)
4.8/5 (37)
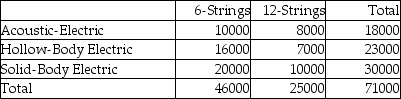
Using the Cross Table below,construct a Component Bar Chart and a Cluster Bar Chart for the number of 6-String and 12-String guitars sold in 2013.
Number of 6-string and 12-string guitars sold in 2013
(Essay)
4.8/5 (40)
It is possible to use statistics to quantify the relationship between variables.
(True/False)
4.9/5 (33)
THE NEXT QUESTIONS ARE BASED ON THE FOLLOWING INFORMATION:
Suppose you own a DVD rental store.
-Give an example of a question where estimating a parameter would be helpful.
(Essay)
4.8/5 (40)
THE NEXT QUESTIONS ARE BASED ON THE FOLLOWING INFORMATION:
What not to get them on Valentine's Day! A recent study among adults in the USA shows that adults prefer not to receive certain items as gifts on Valentine's Day;namely,Teddy bears: 45%;Chocolate: 25%;Jewelry: 15%;Flowers: 12%;Don't Know: 3%.
-Draw a Pareto diagram picturing the "Unwanted Presents."
(Essay)
4.7/5 (39)
THE NEXT QUESTIONS ARE BASED ON THE FOLLOWING INFORMATION:
The data presented below were collected on the amount of time,in hours;it takes an employee,to process an order at a local plumbing wholesaler.
 -Construct cumulative frequency and cumulative percent distributions of the data.
(Essay)
4.9/5 (37)
Dr.Thomas graduated from West Virginia University with a code value = 1 while Professor Harrison graduated from the Marshall University with a code value = 2.The scale of measurement likely represented by this information is:
(Multiple Choice)
4.8/5 (32)
THE NEXT QUESTIONS ARE BASED ON THE FOLLOWING INFORMATION:
The Quality Assurance Department of a large restaurant is attempting to monitor and evaluate customer satisfaction with restaurant services.Prior to their departure,a random sample of customers is asked to fill out a short questionnaire to rate such services as quality of food,price,waiting time to be served,and cleanliness of the place.The Quality Assurance Department prepares weekly reports that are used to improve the services.
-In this restaurant services study,the process of using this information to predict future needs of customers in the restaurant is called:
(Multiple Choice)
4.9/5 (34)
Filters
- Essay(0)
- Multiple Choice(0)
- Short Answer(0)
- True False(0)
- Matching(0)